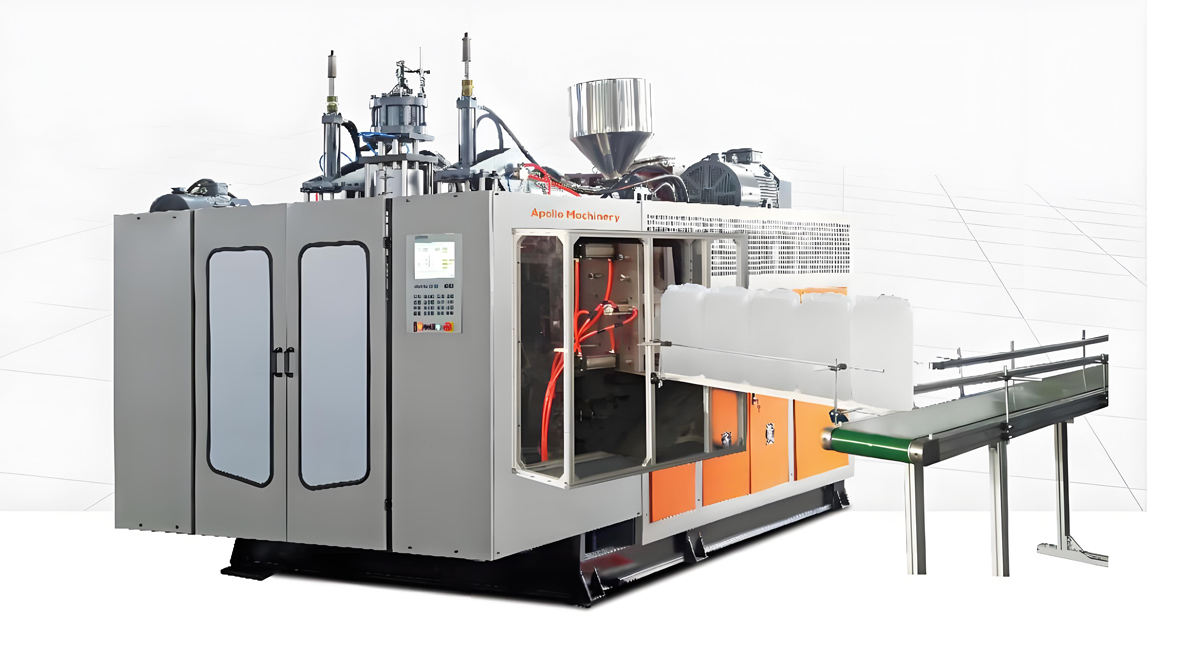

Electricitas adalah input terbesar berulang pada pabrik blow molding ekstrusi yang sudah mengoptimalkan pembelian resin, dan berbeda dengan resin, hampir seluruhnya berada di bawah kontrol sistem. Sebuah pabrik blow molding yang mengubah satu kilogram HDPE menjadi botol jadi dengan menggunakan 0,85 kWh dan pabrik yang melakukan pekerjaan yang sama dengan menggunakan 0,42 kWh menghasilkan bagian yang identik dari bahan baku yang sama – perbedaan itu hanya terjadi pada arsitektur penggerak, lapisan termal, sirkuit udara kompresi, dan cara mesin beroperasi selama detik ketika tidak ada yang bergerak. Artikel ini menjelaskan fisika di balik perbedaan tersebut, lalu membangun metode aritmatika yang dapat diulang yang memungkinkan insinyur pabrik menghitung penurunan kilowatt jam per tahun yang dapat dicapai dengan beralih dari blow molding ekstrusi hidraulik ke blow molding ekstrusi seluruhnya berbasis listrik, tanpa menggunakan lebih dari produksi tahunan dalam kilogram dan angka konsumsi energi spesifik yang diukur.
Selama panduan ini semua penghematan dinyatakan dalam kilowatt-jam, persentase, poin indeks, atau rentang relatif. Struktur tarif sangat berbeda antara wilayah, jenis kontrak, jendela waktu penggunaan, dan sistem beban-persediaan, sehingga setiap upaya untuk menyatakan pengurangan moneter yang universal akan menyesatkan. Ubah angka kilowatt-jam menjadi uang sendiri dengan menggunakan struktur tarif pada kontrak persediaan Anda sendiri – pekerjaan teknis berkaitan dengan mendapatkan nilai kilowatt-jam yang benar, dan itulah yang akan diikuti. Apollo, pabrik Wanplas di Zhangjiagang yang memiliki lebih dari dua puluh tahun pengalaman dalam manufaktur mesin pembentukan tiup ekstrusi dan lebih dari 4.000 mesin yang beroperasi di lebih dari 90 negara, telah membangun Seri Elektrik Tunggal spesifik berdasarkan mekanisme kehilangan yang dijelaskan di bawah ini, dan angka-angka yang digunakan di sini mencerminkan apa yang dapat secara realistis disediakan oleh arsitektur servo-elektrik pada tahun 2026 daripada kasus terbaik untuk pemasaran.
Mengapa arsitektur penggerak adalah variabel energi terkontrol terbesar dalam EBM
Pada pembentukan tiup ekstrusi, mesin menghabiskan sebagian besar setiap siklus tanpa melakukan aktivitas yang sulit secara mekanik. Extruder berputar terus-menerus dan menghasilkan parison, namun unit pemancangan, kereta yang bergerak penstempel, pengaktifan pin membakar, dan gerakan deflashing adalah semua tindakan singkat dan dengan gaya tinggi yang terpisah oleh interval idle yang relatif panjang. Siklus botol HDPE 2L pada mesin dengan dua stasiun mungkin berlangsung 14-22 detik, di mana tindakan pemancangan dan pengangkatan stampangan mungkin membutuhkan waktu 2-4 detik secara total. Semuanya lagi adalah ekstrusi, pendinginan, dan pengambilan bagian.
Profil ini kewajiban adalah alasan mengapa arsitektur penggerak mendominasi gambaran energi ini. Pompa hidrolik displacement tetap harus berputar dengan kecepatan penuh selama siklus penuh, terlepas dari apakah penghantar yang sedang beroperasi memerlukan aliran. Ketika tidak ada aliran yang diminta, minyak hanya dibuang melalui katup pembebasan dan energi diubah menjadi panas yang kemudian harus dihilangkan oleh pemanas minyak - hukuman energi tambahan yang diletakkan di atas hukuman energi utama. Sistem servo-hidraulik mengurangi hal ini dengan mengubah kecepatan pompa sesuai dengan permintaan, namun tetap mempertahankan aliran standby minimum dan masih mengalami kerugian pengurangan dan kebocoran melalui katup dan seal. Mesin yang sepenuhnya elektrik tidak mengonsumsi apa pun dari penggerak kliping dan layar ketika berada dalam keadaan diam, karena motor servo pada torsi tertinggi dan kecepatan nol hanya mengkonsumsi elektronika kontrol dan arus penahan sendiri.
Alasan kedua mengapa arsitektur penting adalah suhu. Minyak hidraulik yang telah dibatasi melalui valve pengurang menjadi panas, dan panas tersebut dilepaskan ke dalam sirkulasi air pendingin. Chiller atau penyejukan tower yang menghilangkannya memakan banyak energi sendiri. Motor pompa 30 kW yang menghabiskan 60 persen dari setiap siklus di bypass memasukkan sekitar 18 kW beban termal ke dalam minyak, yang pada koefisien performa chiller konvensional antara 2,8 dan 3,5 menelan biaya tambahan 5 sampai 6,5 kW daya kompresor untuk menolak. Sanksi kaskus ini biasanya dihapus dari pengukuran mesin tunggal dan menjadi alasan umum mengapa penghematan pada tingkat pabrik yang diukur dari elektrifikasi melebihi penghematan yang diharapkan hanya dari perbandingan nama mesin.
Alasan ketiga adalah kualitas kontrol, yang memengaruhi energi secara tidak langsung, namun nyata. Aksis servo-elastik lebih konsisten dalam menahan profil posisi dan kecepatan dibandingkan dengan katup hidraulik proporsional, terutama pada perubahan suhu selama proses produksi yang panjang. Konsistensi yang lebih baik berarti kontrol ketebalan dinding yang lebih ketat, yang berarti lebih sedikit bahan per bagian, sehingga menghasilkan lebih sedikit kilogram yang ditekan dan dipanaskan per ribuan kotak. Energi per kilogram dan kilogram per bagian merupakan alat yang terpisah, dan arsitektur sepenuhnya elektrik meningkatkan keduanya secara serentak.
Bagaimana tiga arsitektur penggerak EBM sebenarnya mengonsumsi energi
Tiga arsitektur penggerak mendominasi instalasi pemrosesan pembentukan tiup ekstrusi pada tahun 2026: hidrolik displacement fixed, displacement variable atau servo hidrolik, dan seluruhnya elektrik. Memahami mekanisme kerugiannya secara individual merupakan syarat untuk perhitungan energi yang dapat dipercaya, karena setiap arsitektur mengalami kegagalan pada tempat yang berbeda.
Hydraulik Fixed-Displacement: aliran tetap, kerugian tetap
Sirkit klasik hidrolik EBM menggunakan satu atau lebih pompa baling-baling atau gigi displacement fixed yang digerakkan oleh motor acuan kecepatan tetap, umumnya mesin empat arus yang beroperasi pada 1450 rpm. Pompa ini menghasilkan volume minyak yang tetap per putaran, terlepas dari permintaan. Tekanan sistem ditetapkan oleh selang pengembalian, dan aliran berlebihan kembali ke tangki melalui selang tersebut.
Perilaku energi berasal langsung dari gambaran tersebut. Selama pembekuan – beberapa detik ketika cetakan menutup dan tekanan penyekat terbentuk – pompa melakukan pekerjaan yang berguna dan motor mendekati kekuatan tercatatnya. Selama sisa 70 hingga 85 persen siklus, pompa masih berputar, masih mengkonsumsi daya putar untuk mendorong minyak melalui katup pengambilan tekanan, dan masih mengkonversi daya putar tersebut menjadi peningkatan suhu minyak. Tenaga idle yang diamati pada sirkuit tersebut biasanya berada pada 25 hingga 40 persen dari daya motor pompa, dan mesin yang lebih lama dengan pompa yang rumit, sekat yang rusak, dan pengaturan katup pengambilan tekanan yang berkembang dapat melebihi 45 persen.
Kerugian secara standby itu lebih buruk dari kerugian pada kondisi tidak aktif. Banyak pabrik meninggalkan unit daya hidrolik berjalan selama perubahan warna, perubahan warna, pengaturan jam kerja yang singkat, dan pergantian pengawas kerja karena menyalakan dan kembali menyala minyak memerlukan waktu. Mesin yang sebenarnya menghasilkan produksi selama 6.200 jam setahun mungkin memiliki unit daya hidrolik terisi energi selama 7.000 jam. 800 jam produktif tidak menghasilkan energi kilowatt-jam yang nyata, dan tidak menghasilkan sejumlah kilogram, yang membuat angka konsumsi energi spesifik meningkat tanpa terlihat di log proses.
Displacement Berubah dan Hidraulik Servo: Lebih Baik, Tetapi Masih Tidak Stabil
Sistem servo-hidraulik menggabungkan motor servo bermagnet permanen dengan pompa berkapasitas tetap atau berubah dan mengendalikan aliran dengan mengubah kecepatan motor, bukan dengan mengatur aliran. Ketika tidak ada penggerak yang membutuhkan aliran, motor bergerak perlahan ke kecepatan standby rendah atau berhenti sepenuhnya. Energi idle biasanya menjadi 5 hingga 12 persen dari daya motor pompa terstandar, yang merupakan perbaikan yang signifikan bila dibandingkan dengan dasar berkapasitas tetap.
Kerugian residu tetap ada dalam empat tempat. Kehilangan volumetrik melalui interior pompa dan poros katup terus terjadi saat sirkuit dipressurisasi. Penurunan tekanan di atas katup arah dan katup proporsional mengubah sebagian dari setiap aktivasinya menjadi panas bahkan ketika gerakan itu berguna. Kedalaman viskositas minyak berubah dengan suhu, sehingga sirkuit hanya berada di puncak efisiensinya dalam suatu jangkauan yang cukup sempit, biasanya 40 sampai 55°C untuk minyak hidraulik mineral kelas ISO VG 46. Dan akumulasi, jika dipasang, menimbulkan ketidakefisienan pengisian dan pengeluaran yang unik.
Kehilangan akumulasi layak mendapat perhatian khusus karena sering diabaikan. Mesin EBM dengan bantuan akumulasi – yang umum digunakan pada peralatan kelas ABLD besar yang menangani kontainer berukuran 20 L hingga 1500 L di mana tetesan besar harus disalurkan dengan cepat – menyimpan energi hidrolik dalam kantong atau tabung piston yang diisi dengan gas dan melepaskannya selama fase kebutuhan yang tinggi. Efisiensi perjalanan to and from pada simpanan tersebut biasanya 85 hingga 92 persen dalam kondisi yang menguntungkan, tetapi berkurang saat tekanan pra-pengisian berubah, saat gas meloloskan diri melalui kantong selama beberapa bulan, atau saat pembuangan dikendalikan untuk mengontrol kecepatan. Kegagalan 10 persen dalam perjalanan to and from pada akumulasi yang menangani fraksi besar dari kebutuhan energi puncak mesin tidaklah kecil, dan kegagalan itu tidak terlihat tanpa instrumen khusus.
Penuh Elektrifikasi: Torque Hanya Ketika Perlu Torque
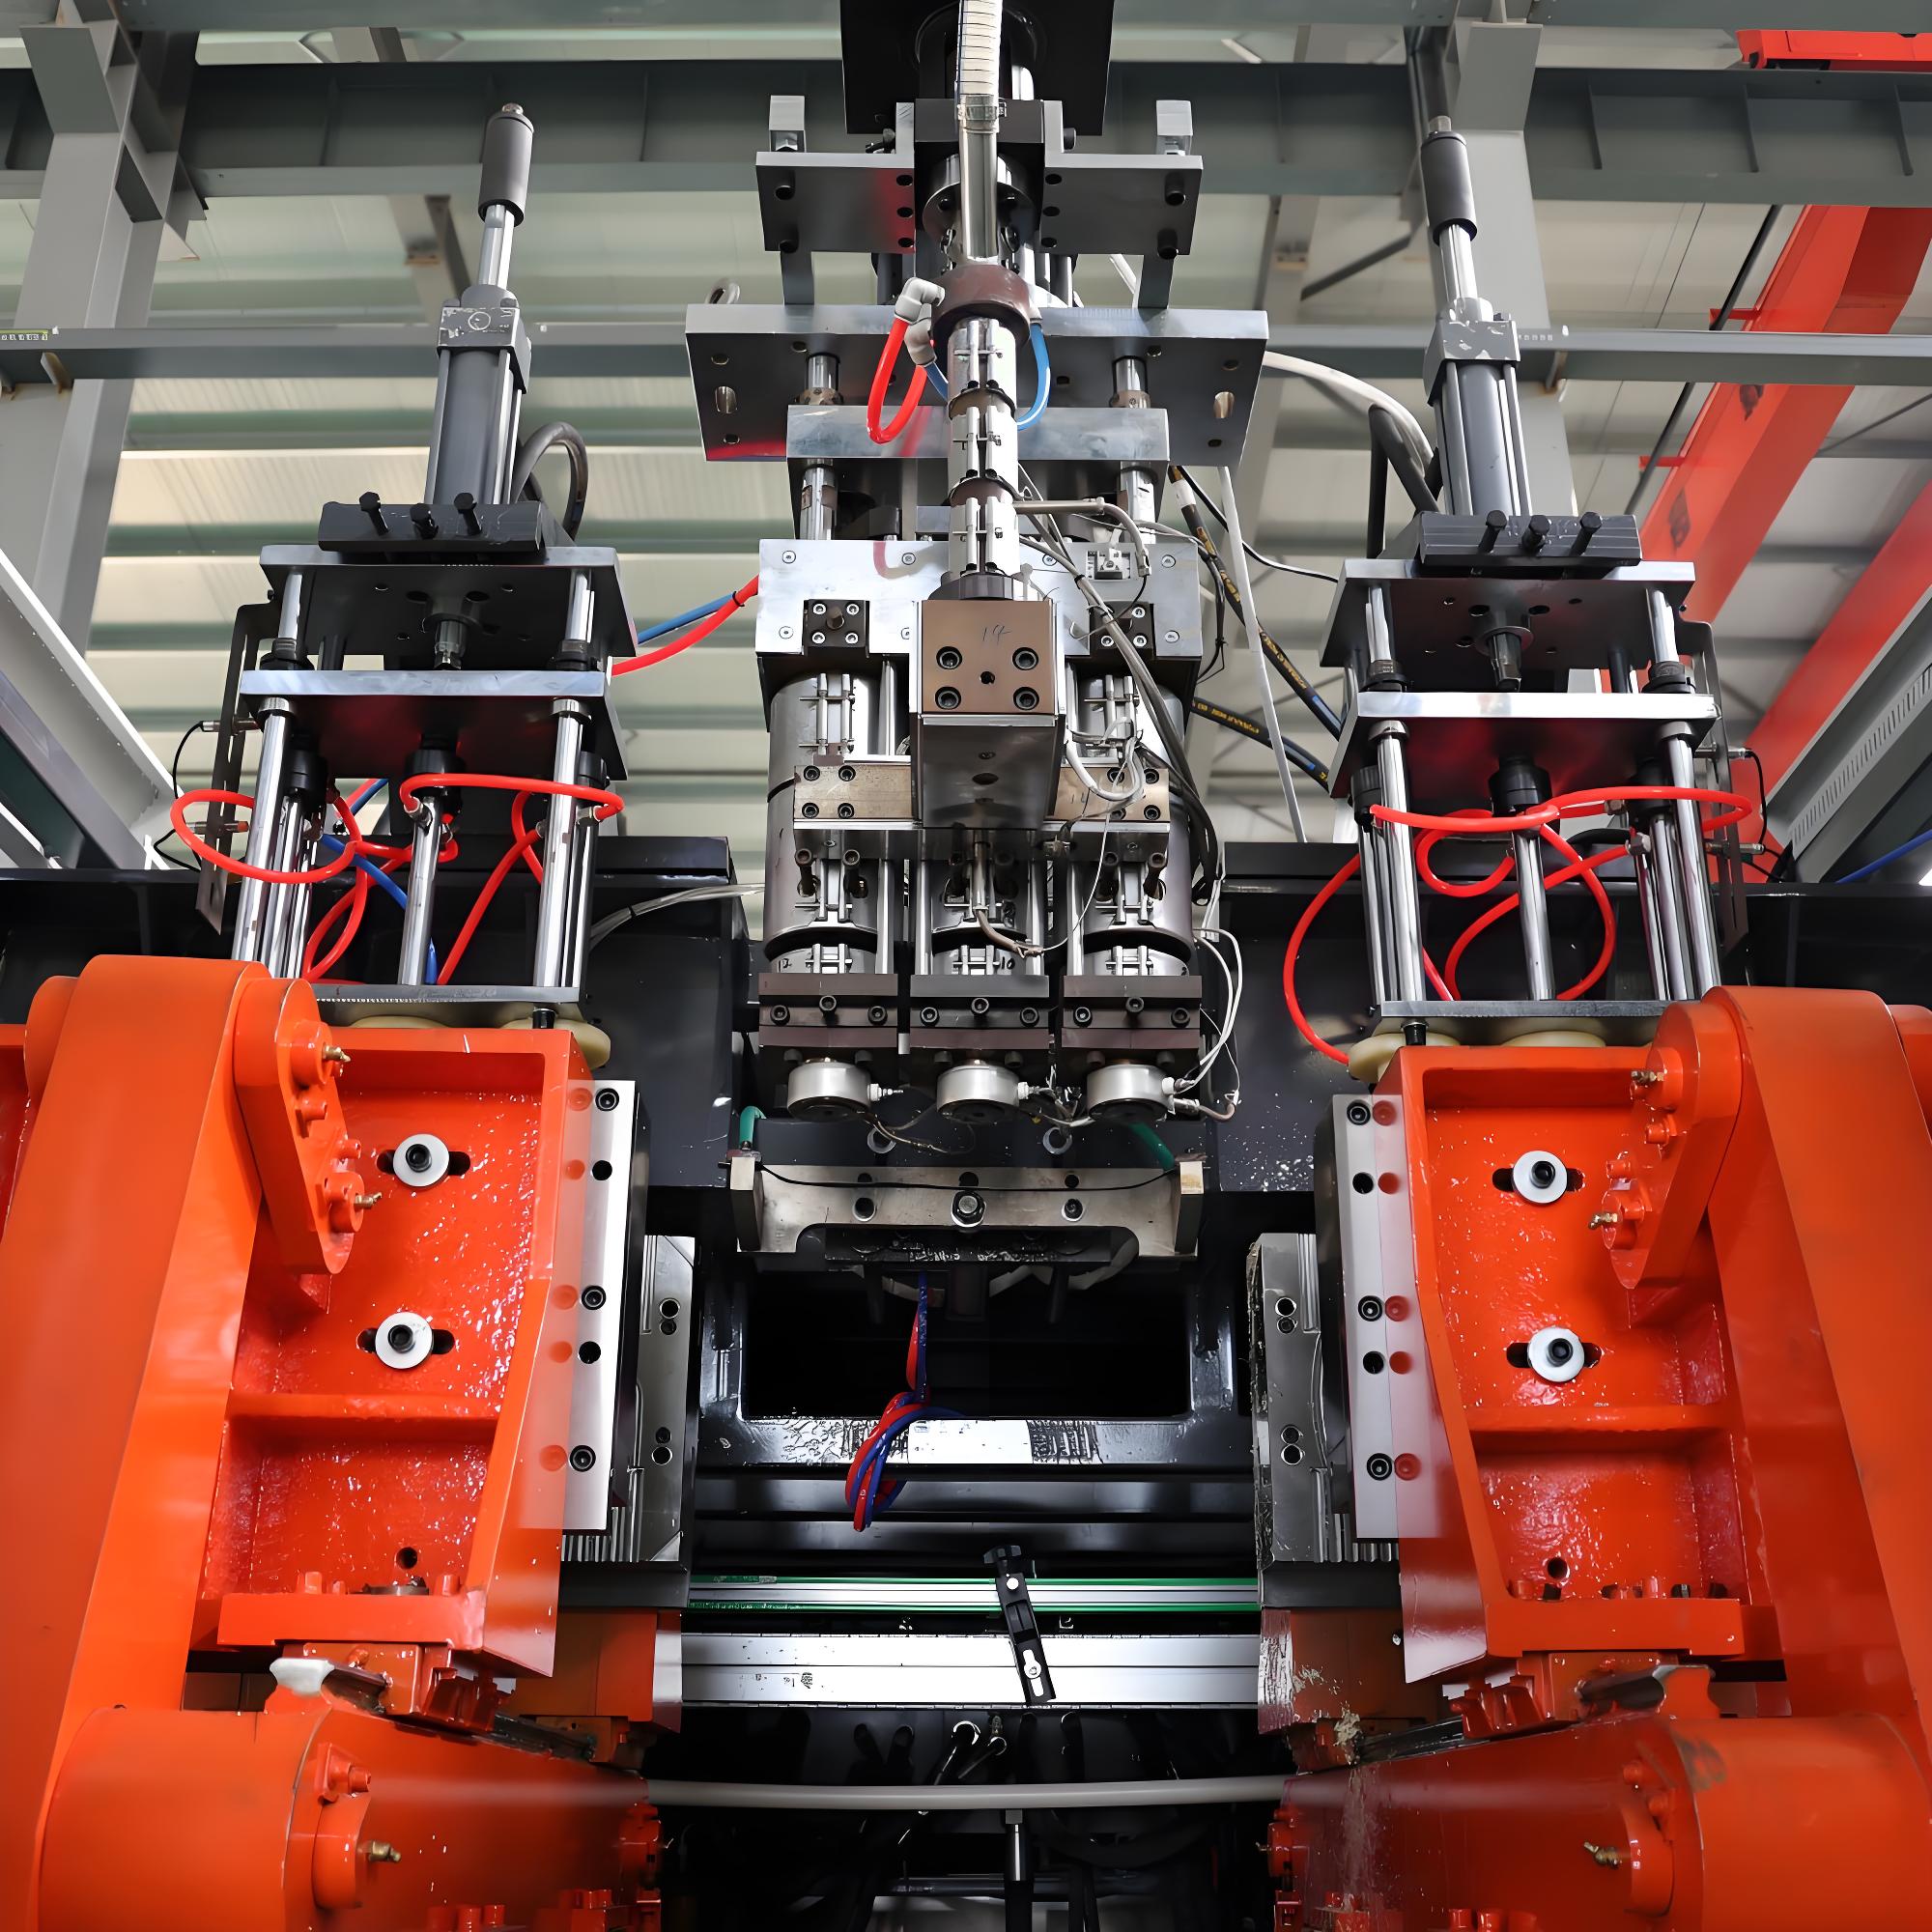
Mesin pembentukan tiup ekstrusi sepenuhnya listrik menggantikan sirkit hidraulik. Unit pemotong dijalankan oleh motor servo yang berfungsi melalui mekanisme reflektor atau tata letak bola-gerigi dan kepala miring. Sproket ekstruder dijalankan oleh motor servo atau motor AC efisiensi tinggi melalui gearbox langsung atau dengan rasio rendah, bukan oleh motor hidraulik. Arah pergerakan kereta, penanaman pipa, deflashing, dan pemindahan bagian diatur oleh sumbu servo tambahan atau oleh penggerak listrik kompak.
Karakteristik energi yang menentukan adalah bahwa sumbu servo yang diam hanya menarik arus yang menahannya ditambah dengan kerugian elektronik penggerak. Pada mesin di mana unit penahan terpasang secara mekanis dalam posisi tertutup oleh geometri toggle, bahkan arus penahannya mendekati nol karena toggle mengangkat gaya penghambatan secara mekanis, bukan motor yang mengangkatnya secara elektrik. Arus standby yang diukur pada sisi gerak mesin yang sepenuhnya berteknologi listrik lebih rendah dari 2 persen dari daya gerak yang terkoneksi, dibandingkan dengan 25 hingga 40 persen untuk mesin yang identik dengan volume tetap.
Manfaat kedua yang kurang dibahas adalah pembongkaran regeneratif. Ketika unit penekan servo mendorong massa yang bergerak pada akhir langkah kerja, motor berfungsi sebagai generator. Pada sistem penggerak dengan bus DC umum, energi yang terpendam digunakan untuk sumbu lain pada bus yang sama, bukan terbuang dalam resistor pembakaran. Pada mesin dengan beberapa sumbu yang disinkronkan dan bus yang dirancang dengan baik, 3 hingga 8 persen energi pergerakan dapat beredar secara internal. Angka ini adalah angka kecil secara terpisah, tetapi bertambah dalam jutaan siklus per tahun.
Arsitektur penuh listrik yang tidak berubah adalah beban pemanasan. Pemanas tabung, pemanas kepala cetakan, dan pemanas lingkaran leher atau ujung pasang mengambil daya resistif terlepas dari jenis daya. Hal ini juga tidak mengubah kebutuhan udara kompresi, kebutuhan air pendingin, atau kebutuhan peralatan tambahan. Memahami batas ini sangat penting untuk menentukan harapan yang realistis, dan itulah mengapa pembagian persentase dalam paragraf berikut menjadi lebih penting daripada segala klaim utama.
Tabel 1: Karakteristik energi arsitektur drive
| Karakteristik | Hidrolik Dengan Volume Tetap | Hidraulik Variabel/ Servo | Sepenuhnya Elektrik |
|---|---|---|---|
| Tenaga idle sebagai persentase dari tenaga gerak yang ditetapkan | 25–40% (unit yang tergores mencapai 45%) | 5–12% | Di bawah 2%. |
| Kerugian standby selama stop dan penggantian cetakan | Tinggi — unit daya biasanya tetap berjalan, | Menengah - motor berjalan lambat atau tidur | Sangat Rendah — mengendarai dengan kecepatan nol, hanya pemanas |
| Kerugian round-trip akumulator (jika dilengkapi) | 8-15% dari energi yang disimpan | 8–15%, menurun dengan gangguan pengisi awal | Tidak Berlaku — tidak ada gudang hidrolik |
| Penggagalan katup dan kehilangan kebocoran | Tinggi | Menengah | Tidak ada |
| Panas limbah yang dibuang ke dalam sirkuit pendingin | Tinggi – diperlukan radiator minyak khusus. | Medium – cooler minyak yang lebih kecil | Rendah — ventilasi kabinet penggerak hanya, |
| Pemulihan energi saat melambat | Tidak ada | Limited | 3–8% energi gerak melalui pengiriman listrik DC (bus sharing) |
| Band SEC biasa, kontainer PE (kWh/kg) | 0,65–0,90 | 0,50–0,70 | 0,35–0,55 |
| Reproducibility pergerakan penekanan dan kereta | Maksimal, bergerak sesuai suhu minyak | Good | Cukup baik, tidak tergantung pada suhu. |
| Derajat kebisingan di ruang mesin | Tinggi | Menengah | Rendah |
| Kemanfaatan kamar bersih dan obat-obatan, | Rendah - risiko kabut minyak dan kebocoran | Menengah | Tinggi – tidak ada cairan hidraulik |
| Beban perawatan (fluida, filter, dan seal) | Tinggi | Menengah | Rendah |
| Jangkauan pengeluaran modal relatif | Rendah | Menengah | Tinggi hingga premium |
Di mana Kilowatt-Jam Perjalanan: Perhitungan Energi Berdasarkan Persentase. Indonesia memerlukan tanda SNI, Thailand memerlukan TISI, Malaysia memerlukan SIRIM, dan Vietnam memerlukan tanda persetujuan CR untuk banyak wadah rumah tangga dan makanan. Alat itu sendiri harus memenuhi persyaratan Direktif Alat CE, dan bahan-bahan yang bersentuhan dengan makanan harus memenuhi standar FDA 21 CFR 177 dan GB
Sebelum penghematan dapat diperhitungkan, garis dasar harus diuraikan. Sel-sel pembentukan pilling dan pembentukan cetakan tidak merupakan satu beban saja; mereka adalah kumpulan beban dengan perilaku yang sangat berbeda, dan proses listrik hanya menyerang salah satu di antaranya secara langsung. Angka persentase di bawah ini merupakan distribusi umum yang diukur di seluruh sel-sel EBM dengan ukuran sedang yang menghasilkan wadah PE, dan mereka harus dianggap sebagai patokan awal yang akan diganti dengan data sub-meteran Anda segera setelah data tersebut ada.
Pemanasan dan pengepresan plastik: 35 sampai 45 persen
Sel ini adalah blok tunggal terbesar dan sebagian besar tidak tergantung pada arsitektur. Ini mencakup pita pemanas tempurung, pemanas kepala die, pemanas adaptor dan pengubah layar, serta pekerjaan mekanik yang dilakukan oleh roda ekstruder dalam pemotongan dan pengangkutan melastis. Pada ekstruder tunggal yang beroperasi dengan baik dengan rasio L/D sekitar 25 sampai 30:1 untuk memproses HDPE, bagian yang signifikan dari entalpi yang dibutuhkan untuk memanaskan resin dari suhu ruangan hingga 175 sampai 210 °C berasal dari gesekan viskok daripada dari pita pemanas. Setelah bar keluar dari keadaan stabil, siklus kerja pemanas pada zona tengah dan depan biasanya turun di bawah 20 persen, dan pada roda gesekan tinggi, zona depan mungkin membutuhkan pendinginan bukan pemanasan.
Enthalpi teoretis yang diperlukan untuk menghangatkan dan mencairkan HDPE dari 25 °C menjadi 200 °C adalah sekitar 0,19 hingga 0,22 kWh per kilogram, yang mencakup kapasitas panas spesifik sekitar 2,3 kJ/kg·K dalam keadaan padat, panas pencairan sekitar 200 hingga 230 kJ/kg, dan kapasitas panas spesifik keadaan cair. Jadi, energi ekstrusi yang diukur lebih besar dari 0,25 kWh/kg merupakan ketidakefisienan: radiasi dari permukaan silinder yang tidak terlindungi, konduksi ke rangka, pita pemanas yang terlalu besar yang berulang melawan pendinginan aktif, atau geometri sisi yang menghasilkan panas sergap yang jauh lebih banyak daripada apa yang diperlukan oleh proses dan kemudian membutuhkan pendinginan silinder untuk menghilangkannya.
Pemancangan dan gerakan pembentukan: 15-25%.
Ini adalah blok yang diserang oleh elektrifikasi secara langsung. Ini mencakup pembukaan dan penutupan penyekar, pemeliharaan daya pemegang selama pemeliharaan dan pendinginan, pergerakan gerobak pada mesin shuttle, dan penekanan pin pemeliharaan atau pin kalibrasi. Pada mesin hidrolik berkapasitas tetap, blok ini meningkat karena kerugian bypass yang dijelaskan sebelumnya; pada mesin sepenuhnya listrik, blok ini mengecil sangat besar karena energi hanya ditarik selama gerakan yang sebenarnya. Pada prakteknya, beralih dari mesin hidrolik dengan kapasitas tetap ke mesin listrik 100% biasanya mengurangi blok ini sebesar 55 hingga 75%.
Perangkat daya hidrolik standby: 10 hingga 20 persen
Pada mesin listrik penuh, blok ini pada dasarnya nol. Pada mesin hidraulik dengan kapasitas tetap, ini merupakan salah satu kerugian terbesar yang dapat dihindari di seluruh pabrik, dan tidak terlihat oleh operator karena pompa membuat suara yang sama, baik sedang bekerja atau tidak. Pada mesin servo-hidraulik, umumnya mencapai 3 hingga 7 persen. Karena blok ini benar-benar menghilang dengan elektrifikasi, bukan hanya mengecil, ini adalah penggerak utama penurunan persentase utama.
Udara kompres untuk menghembus: 10 hingga 20 persen
Sistem air pendingin (mold, minyak, tangki)
Sistem air pendingin: 8 hingga 15 persen
Pendinginan mesin pemotong, pendinginan oli pada mesin hidrolik, pendinginan area penampungan exstruder, dan pendinginan pada zona silinder semua menggunakan sirkulasi air dingin dan air menara. Tenaga kompresor dingin, tenaga pompa, dan tenaga kipas menara semua termasuk dalam blok ini. Elektrifikasi secara tidak langsung mengurangi kelompok ini dengan menghilangkan beban pendinginan oli, biasanya sebesar 15% - 30% dari kelompok.
Peralatan tambahan: 5-10%
Pemindah bahan dan alat pengangkut vakum, pengering dehumidifier di mana bahan-bahan yang higroskopis seperti PA, PC atau PETG diproses, pemasaran pusat, granulator pemanasan ulang, pengangkut keluar, alat pengecekan kebocoran, dan stasiun penyelesaian akhir. Blok ini tidak tergantung pada arsitektur tetapi sering kali terlalu besar. Granulator pemanasan khusus seringkali tetap beroperasi terus-menerus meskipun hanya perlu beroperasi secara teratur.
Tabel 2: Pembagian energi dari sel EBM berdasarkan desain penggerak
| Blok energi | Jarak normal per bagian. | Hidrolik tetap (indeks, basis 100) | Servo hidraulik (indikator), | Penuh listrik (indikator) |
|---|---|---|---|---|
| Pemanasan oleh ekstrusi and plasticising | 35–45% | 40 | 40 | 38 |
| Pemanasan dan gerakan penciptaan cetakan | 15–25% | 20 | 13 | 7 |
| Unit daya hidraulik siaga dan bypass. | 10–20% | 15 | 15, | 38 |
| Udara kompresi untuk mendorong dan mengaktifkan | 10–20% | 14 | 14 | 14 |
| 35–45 % | 8–15% | 11 | 9 | 8 |
| Peralatan tambahan (pemanasan, pengiriman, pembuatan granula) | 5–10% | 7 | 7 | 7 |
| Indeks sel total | 100% | 107% (garis dasar ditetapkan menjadi 100 setelah dinormalisasi). | 88 | 74 |
Normalisasi kolom dengan kapasitas tetap menjadi indeks 100 menghasilkan indeks servo-hidraulik sekitar 82 dan indeks sepenuhnya elektrik sekitar 69, yang sesuai dengan penurunan 18% dan 31% masing-masing pada batas sel yang seluruhnya. Perhatikan bahwa angka-angka batas sel ini lebih konservatif daripada angka-angka untuk mesin saja yang sering dinyatakan, karena mereka termasuk udara kompresi dan peralatan tambahan yang tidak meningkat dengan elektrifikasi. Saat membandingkan tawaran dari penyedia, selalu konfirmasi batas mana yang dimaksudkan.
Konsumsi Energi yang Spesifik: Satuan yang Mencerminkan Performa Industri dari Pabrik ke Pabrik
Konsumsi energi spesifik, yang disingkat SEC dan dinyatakan dalam kilowatt jam per kilogram produk yang baik, adalah satu-satunya metrik energi yang bertahan dalam hadirnya perubahan ukuran mesin, kombinasi produk, pola shift, atau negara. Tenaga dalam kilowatt tidak memberi Anda informasi apa-apa tanpa durasi yang ditempuh. Kilowatt jam per tahun tidak memberi Anda informasi apa-apa tanpa produktivitas. Pada SEC, kedua hal ini di normalisasi dan memungkinkan baris botol shampo berkapasitas 200 ml dibandingkan dengan baris jerrycan berkapasitas 20 liter dengan landasan yang dapat diterima.
Memperjelas Metrik Dengan Tepat
SEC dihitung sebagai total energi listrik yang dikonsumsi selama periode yang ditentukan, dibagi dengan berat produk yang dapat dijual yang diproduksi dalam periode yang sama. Tiga keputusan definisi harus diungkapkan dan kemudian dijaga tetap:
- Batas ukuranHanya kotak terminal mesin, mesin beserta pelengkap khusus, atau sel pabrik lengkap yang mencakup alokasi proporsional dari udara kompresi dan air dingin. Setiap hal yang sah; mengelompokkan mereka tidak.
- Berdasarkan massaKilogram resin diekstrusi, atau kilogram produk jadi yang dapat dijual setelah penghilangan jus dan penolakan kualitas. Yang kedua adalah dasar yang jujur, karena jus yang diulang dan dimasukkan kembali sudah berhasil menggunakan energi pembakaran sekali. Pada wadah tipikal dengan pembagian dan mesin pemantuk, jus dapat mewakili 15 persen sampai 40 persen dari massa yang diekstrusi, sehingga dua dasar tersebut dapat berbeda lebih dari satu faktor.
- Jendela waktuSatu jam produksi stabil, satu shift penuh, atau satu bulan berjalan. Jendela bulanan menangkap mulai berjalan, perubahan cetakan, dan periode tidak aktif dan oleh karena itu memberikan angka yang sebenarnya menjelaskan bacaan meter,
Konvensi yang digunakan dalam seluruh artikel ini adalah: batas sel yang seluruhnya meliputi pembangkit udara kompresi, dasar massa produk siap jual, dan jendela bulanan. Konvensi ini paling berguna untuk perencanaan anggaran tahunan karena dapat langsung menggandakan terhadap tonase penjualan.
Batas referensi untuk wadah PE
Selama masa penggunaan mesin pembuaan dengan proses ekstrusi, konsumsi energi khusus untuk wadah yang terbuat dari PVC-U dan PVC dengan kapasitas 200 ml hingga 20 l biasanya bergerak dalam kisaran yang cukup konsisten. Mesin hidrolik generasi lama dengan displacement yang tetap dan beroperasi pada faktornya yang sedang dengan tabung yang tidak diisolasi, biasanya akan mencatat 0,65 sampai 0,90 kWh/kg. Mesin hidrolik yang terjaga dengan baik, yang menggunakan pompa dengan displacement yang dapat diubah dan tabung yang diisolasi, akan mencatat 0,50 sampai 0,70 kWh/kg. Mesin yang modern, yang beroperasi sepenuhnya secara elektrik, dan berukuran yang sesuai dengan produknya, yang melakukan operasi di atas faktornya yang sehat, biasanya akan mencatat 0,35 sampai 0,55 kWh/kg.
Kematangan juga penting, begitu juga mesin. PP memerlukan suhu pembakaran yang sedikit lebih tinggi daripada HDPE dan memiliki suhu pembakaran yang lebih tinggi, yang meningkatkan SEC sekitar 5 sampai 10 persen. PVC kaku diproses pada suhu pembakaran yang lebih rendah, biasanya 165 sampai 185 °C, tetapi membutuhkan manajemen gesekan yang sangat hati-hati dan seringkali kecepatan putaran yang lebih rendah, yang dapat menaikkan SEC ke arah mana pun. Serat teknis seperti PC dan PA menambah beban pengeringan yang dapat memberikan 0,05 sampai 0,12 kWh/kg sendiri, dan PC juga membutuhkan suhu pembakaran yang jauh di atas 250 °C. Oleh karena itu, setiap standar SEC harus menyatakan bahan-nya.
Arti-rik Arsitektur
Perhitungan energi listrik tahunan dapat diuraikan menjadi satu ekspresi:
Konsumsi listrik tahunan (kWh) = Konsumsi energi khusus (kWh/kg) × Produksi yang dapat dijual per tahun (kg)
Hasil dari perubahan arsitektur adalah:
Kilowatt-tahun yang diselamatkan = (baseline SEC – SEC dengan seluruh energi listrik) × Produksi jualan (kg)
Keindahan dari formulasi ini adalah bahwa tidak diperlukan asumsi tentang waktu siklus, jumlah mesin, pola shift, atau penggunaan. Semua itu sudah terintegrasi dalam SEC yang diukur dan volume tonase tahunan yang telah dicapai. Pekerjaan teknis terletak pada mengukur SEC dasar dengan jujur dan menetapkan target SEC yang dapat ditunjukkan bagi mesin pengganti — bukan dalam kalkulasi itu sendiri.
Jam operasional tahunan dan faktor beban: Membuat model standar operasional
Meskipun metode SEC tidak memerlukan model jam untuk menghitung pengurangan, model jam sangat penting untuk dua tujuan lain: menentukan besarnya infrastruktur listrik, dan memahami mengapa dua pabrik dengan mesin yang identik melaporkan nilai SEC yang berbeda.
Tiga pola perpindahan standar
Operasi dua-pangkat yang beroperasi lima hari per minggu dengan libur resmi biasanya mencapai 3.800 hingga 4.200 jam terprogram per tahun, di mana kira-kira 3.300 hingga 3.700 jam tersebut produktif setelah penggantian cetakan, perubahan warna, dan perawatan. Operasi tiga-pangkat yang beroperasi lima atau enam hari per minggu mencapai 6.000 hingga 7.000 jam terprogram, dengan 5.300 hingga 6.300 jam produktif. Operasi yang benar-benar terus menerus beroperasi tujuh hari dengan jendela perawatan yang direncanakan mencapai sekitar 8.000 jam terprogram, dengan 7.200 hingga 7.600 jam produktif.
Rasio jam produktif dengan jam yang dijadwalkan adalah tempat di mana arsitektur hidrolik dan listrik berbeda secara drastis. Selama 400 sampai 600 jam non-produktif dalam satu tahun dengan tiga shift, hidrolik yang beroperasi berusaha terus menggambarkan 25 hingga 40 persen dari daya tertinggi sementara tidak menghasilkan apa pun. Mesin listrik yang sama dalam kondisi yang sama hanya mengambil daya pengisian resiran, yang dapat dikurangi 30 sampai 50 persen dengan menggunakan penurunan suhu siaga 40 sampai 60 °C di bawah suhu proses. Ini adalah mekanisme di mana elektrifikasi meningkatkan SEC lebih dari kualifikasi blok gerak murni yang diusulkan.
Faktor beban dan konsekuensinya
Faktor beban adalah rasio antara daya tarik rata-rata aktual dan beban terhubung dari mesin. Sel golongan EBM yang sebenarnya bekerja dengan faktor beban 0,55 hingga 0,85. Mesin yang disediakan dengan kasar untuk produk berkapasitas besar di masa depan tetapi saat ini menjalankan popok kecil akan berada di ujung bawah; mesin yang beroperasi pada keluaran ekstrusi standar dengan set cetakan penuh akan berada di ujung atas.
Faktor beban mempengaruhi mesin hidrolik dan listrik dengan asimetris. Pompanya hidrolik pada faktor beban yang rendah masih berputar pada kecepatan penuh, sehingga pengurangan sela tetap konstan secara absolut, sementara keluaran yang berguna turun — KTI berkurang dengan cepat seiring dengan penurunan faktor beban. Penggerak servo-elektronik pada faktor beban rendah hanya menyedot arus yang lebih kecil, sehingga KTI-nya memburuk hanya dengan sangat perlahan. Dalam praktik, pada faktor beban 0,55 keuntungan KTI arsitektur yang sepenuhnya elektrik terhadap hidrolik dengan displacement tetap membentuk selisih 45 hingga 55 persen, sedangkan pada faktor beban 0,85 menjadi 25 hingga 32 persen. Fasilitas dengan buku pesanan yang fluktuatif dan perubahan produk yang sering, oleh karena itu mendapat keuntungan yang tidak proporsional dari elektrifikasi.
Tabel 3: Jam Kerja dan Faktor Persediaan
| Pola Shift | Jam yang dijadwalkan per tahun | Jam produktif | Jam kerja yang tidak produktif | Faktor beban tipikal | Penalti SEC relatif pada sistem hidrolik |
|---|---|---|---|---|---|
| Dua shift, lima hari | 3,800–4,200 | 3.300–3.700 | 400–600 | 0,55 – 0,70 | Tinggi (reset yang sering, idle yang lama) |
| Tiga shift, lima sampai enam hari | 6.000–7.000 | 5.300–6.300 | 500–800 | 0,65–0,80 | Menengah |
| Terusan, tujuh hari | 7.800–8.200 | 7,200–7,600 | 300–600 | 0.75–0.85 | Rendah (tetapi kWh absolut terbesar) |
Perhitungan yang dijalankan: penurunan kWh pada 500, 1500, dan 3000 ton per tahun
Kalkulasi berikut menggunakan metode SEC pada tiga skala pabrik yang menyandikan sebagian besar operasi pembentukan tiup independen. Semua angka dalam kilowatt-jam dan persentase. Tidak ada nilai moneter yang diberikan, karena struktur tarif bergantung pada wilayah, kontrak, biaya permintaan, dan jendela waktu penggunaan. Gunakan struktur tarif Anda sendiri pada angka kilowatt-jam ini untuk memperoleh hasil keuangan yang relevan dengan perjanjian pasokan Anda.
Definisi skenario
Tiga pasangan basis dan target dievaluasi di setiap tingkat keluaran, yang mewakili kemungkinan hasil yang realistis:
- Kasus konservatif:basis 0,60 kWh/kg (mesin servo-hidrolik yang dirawat dengan baik) meningkat menjadi 0,50 kWh/kg. Perbaikan 0,10 kWh/kg, atau 16,7 persen.
- Pernyataan kasus umum:titik awal 0,70 kWh/kg (flot pelayaran yang campuran terdiri dari mesin hidrolik berusia berbeda) meningkat menjadi 0,45 kWh/kg. Perbaikan 0,25 kWh/kg, atau 35,7 persen
- Kasus terbaik: baseline 0,90 kWh/kg (bahan lama dengan distribusi tetap pada faktor beban rendah dengan tabung tidak terisolasi) yang ditingkatkan hingga 0,35 kWh/kg. Peningkatan 0,55 kWh/kg, atau 61,1 persen.
Tabel 4: Penurunan kWh Satu Tahun pada Tiga Kelas Produksi
| Annual Output | Kasus | SEC (kWh/kg) pada kondisi awal | SEC listrik (kWh/kg) | Basis tahunan kWh | Kilowatt-tahun elektrik | kW/thal Kilowatt-hour yang disimpan setiap tahun | Pengurangan | Indeks (titik awal = 100) |
|---|---|---|---|---|---|---|---|---|
| 500 t/a (500.000 kg) | Konservatif | 0,60 | 0.50 | 300.000 | 250.000 | 50.000 | 16,7% | 83,3 |
| 500 t/tahun | Umum | 0,70 | 0,45 | 350,000 | 225.000 | 125,000 | 35,7% | 64,3 |
| 500 t/tahun | Kasus terbaik | 0,90 watt | 0,35 | 450.000 | 175.000 | 275.000 | 61,1% | 38.9 |
| 1.500 t/tahun (1.500.000 kg) | Konservatif | 0,60 | 0.50 | 900,000 | 750.000 | 150.000 | 16,7% | 83,3 |
| 1.500 t/tahun | Umum | 0,70 | 0,45 | 1.050.000 | 675.000 | 375.000 | 35,7% | 64,3 |
| 1.500 t/tahun | Kasus terbaik | 0,90 watt | 0,35 | 1.350.000 | 525.000 | 825.000 | 61,1% | 38.9 |
| 3,000 t/a (3,000,000 kg) | Konservatif | 0,60 | 0.50 | 1.800.000 | 1,500,000 | 300.000 | 16,7% | 83,3 |
| 3.000 t/tahun | Umum | 0,70 | 0,45 | 2.100.000 | 1.350.000 | 750.000 | 35,7% | 64,3 |
| 3.000 t/tahun | Kasus terbaik | 0,90 watt | 0,35 | 2.700.000 | 1.050.000 | 1.650.000 | 61,1% | 38.9 |
Membaca tabel dengan benar
Tiga kesimpulan dapat diambil dari tabel ini. Pertama, persentase pengurangan itu tidak tergantung pada skala – itu hanya tergantung pada pasangan SEC, bukan pada tonase. Pabrik dengan kapasitas 500 ton dan pabrik dengan kapasitas 3.000 ton akan mencapai persentase yang sama; hanya kilowatt-hour yang absolut yang berbeda. Kedua, penghematan absolut berskala secara linear dengan tonase, yang berarti logika pengembalian modal sangat menguntungkan pabrik dengan tingkat penggunaan tinggi. Ketiga, penurunan antara persyaratan konservatif dan skenario terbaik adalah faktor 5,5, yang mengapa pengukuran dasar jauh lebih penting daripada spesifikasi target. Pabrik yang mengasumsikan dasar 0,70 kWh/kg saat angka yang sebenarnya adalah 0,85 kWh/kg akan mempersingkat penghematannya lebih dari setengah.
Tahap yang berguna untuk memeriksa peralatan adalah jumlah per mesin. Satu mesin mid-size EBM yang menghasilkan 2 ton gelas HDPE dengan kecepatan 45 kg per jam dan menjalankan 6.000 jam produktif per tahun menghasilkan sekitar 270 ton massa diekstrusi. Setelah dikurangi flash yang memperoleh produk jadi dengan hasil sekitar 78 persen, output yang dapat dijual adalah sekitar 210 ton. Di kasus klasik, mesin tersebut saja menghasilkan sekitar 52.500 kWh penghematan per tahun. Sebuah pabrik dari tujuh mesin ini dengan demikian mendekati tingkat 1.500 ton/per tahun di Tabel 4.
Variabel proses yang menggerakkan konsumsi energi spesifik
Membeli mesin yang sepenuhnya berbasis listrik menentukan lantai baru, tetapi pengaturan proses menentukan di mana pabrik tersebut benar-benar beroperasi. Berikut adalah variabel yang memiliki dampak terukur terbesar pada SEC dan sebagian besar dapat diubah tanpa pengeluaran modal.
Suhu Plihan dan Profil Suhu
Untuk wadah HDPE, jendela suhu cair antara 175 hingga 210 °C mencakup hampir semua pekerjaan komersial. Mengoperasikan pada suhu cair 205 °C saat temperatur 185 °C dapat menghasilkan parison yang cukup baik membuat energi terbuang dua kali: satu pada perangkat pemanas dan pekerjaan penyaringan yang diperlukan untuk mencapai suhu tinggi, dan lagi pada sirkulasi pendingin yang harus menyelesaikan energi kinetis ekstra sebelum bagian dapat dikeluarkan. Setiap 10 °C suhu cair yang tidak perlu menambahkan sekitar 0,005 hingga 0,008 kWh/kg pada sisi pemanas dan memperpanjang waktu pendinginan sebesar 3 hingga 6 persen, yang mengurangi produksi dan secara otomatis meningkatkan SEC lebih lanjut.
Profil suhu tabung yang meningkat (lebih dingin di zona pemberian, lebih hangat ke arah kepala acuan) umumnya menggunakan energi total yang lebih rendah dibandingkan dengan profil datar, karena memungkinkan kerja pengikisan untuk melakukan pemanasan di zona kompresi, dan tidak memaksakan konduksi dari dinding tabung. Pendinginan ruas pemberian harus diatur hanya sehangat mungkin untuk mencegah pembentukan jaringan, biasanya 20 hingga 35 °C untuk PE; mendinginkan ruas pemberian terlalu dingin bermanfaat secara langsung pada pemanasan tabung.
Screw Speed, L/D Ratio and Compression Ratio
Geometri propeller menentukan keseimbangan antara pemanasan rempahan dan pemanasan konduksi. Extruder propeller tunggal dengan rasio L/D 25 sampai 30:1 dan rasio kompresi 2,5 sampai 3,5:1 merupakan konfigurasi standar untuk pembentukan tiup ekstrusi PE, dan dalam lingkup tersebut, propeller penghalang dengan bagian pencampuran biasanya menghasilkan SEC 8-15% lebih rendah dibandingkan dengan propeller zona tiga konvensional pada output yang sama, karena mencapai homogenitas cairan pada suhu cairan yang lebih rendah.
Kecepatan silinder seharusnya diatur untuk mencapai waktu penurunan parison yang diperlukan dengan RPM terendah yang praktis. Mengoperasikan silinder cepat dan kemudian menahan dengan pompa cairan atau penampung yang terbatas mengubah daya poros menjadi panas yang kemudian dihilangkan oleh pendinginan tabung — ini adalah kerugian murni. Ketika pompa cairan atau pompa gigi telah dipasang, sebaiknya digunakan untuk menstabilkan tekanan keluaran, bukan untuk mengkompensasi silinder berkecepatan yang terlalu tinggi.
Jaket Isolasi barrel
Permukaan tabung yang telanjang pada suhu 190 hingga 210°C memancar dan konveksi secara terus-menerus ke dalam bilik mesin. Memasang jaket isolasi yang dapat dilepas di atas tabung dan kepala acuan mengurangi energi pemanas sebesar 15 hingga 25 persen, dengan jumlah yang lebih besar berlaku untuk mesin yang berdekatan dengan ruang atau ruang ber-AC. Manfaat sekunder juga sama berharga: suhu zona yang lebih stabil, pemanasan lebih cepat dari keadaan dingin, suhu sekitar mesin yang lebih rendah, dan risiko kebakaran untuk operator yang lebih rendah. Ketidakmampuan pengerjaan rendah, dan langkah ini berlaku secara sama untuk mesin hidrolik dan mesin yang sepenuhnya listrik.
Suhu air pendingin cetakan
Air pendingin cetakan dalam rentang 8-15 °C adalah standar untuk wadah HDPE. Setiap derajat yang lebih dingin akan memperpendek waktu pendinginan tetapi meningkatkan daya kompresor pendingin sebesar 2-3% per derajat. Optimum bukanlah temperatur paling rendah yang dapat dicapai, tetapi temperatur paling tinggi yang masih memenuhi target waktu siklus tanpa menyebabkan masalah pengurangan ukuran atau pertumbuhan sisi cetakan. Banyak pabrik menjalankan air dingin pada 7 °C karena kebiasaan, padahal 12 °C akan menghasilkan siklus yang sama, mengorbankan 10-15% energi kompresor untuk tidak ada.
Kecepatan arus memiliki arti yang sama dengan suhu. Aliran turbulen dalam saluran pendingin, yang ditandai dengan jumlah Reynolds di atas sekitar 4.000, mentransfer panas yang lebih efektif beberapa kali lipat dibandingkan dengan aliran lapisan. Saluran yang disesuaikan atau sebagian ditutup memaksa chiller untuk menyesuaikan dengan suhu pemberian yang lebih rendah. Descaling saluran pendingin cetakan secara tahunan adalah langkah yang relatif sederhana, berhemat sedang yang kebanyakan pabrik tunda.
Pengaturan Tekanan Angin dan Pemulihan Venturi
Udara dipompa secara rutin dengan tekanan tinggi tunggal antara 8 dan 10 bar saat proses hanya membutuhkan tekanan ini selama pembengkakan awal. Penyediaan fase, yaitu satu impuls tekanan tinggi yang singkat untuk membentuk wadah melawan permukaan cetakan, diikuti oleh tekanan pengereman yang lebih rendah antara 4 dan 6 bar selama pendinginan, dapat mengurangi peningkatan massa udara yang dikonsumsi per bagian hingga 20 hingga 35 persen. Di mana kontrol mesin memungkinkan tekanan pre-blow dan main-blow yang terpisah, ini adalah perubahan setting dan bukan perubahan hardware.
Pemulihan udara berjalan lebih jauh. Sistem pemulihan basah berbasis venturi atau receiver menangkap sisa dari setiap siklus penyingkiran dan mengembalikannya ke receiver tegangan tinggi yang menyediakan pengguna udara kerja rendah seperti silinder, konveyor, dan pelepasan bagian. Kecepatan pemulihan sebesar 20 hingga 40 persen dari volume udara penyingkiran dapat dicapai pada mesin dengan berkapasitas besar. Karena pembuatan udara kompresi adalah salah satu konversi energi yang paling nonefisien di pabrik - biasanya hanya 10 hingga 15 persen dari energi input kompresor yang berfungsi sebagai kerja pneumatik yang berguna - setiap meter kubik yang tidak dibuat bernilai beberapa kali nilainya terlihat.
Pengontrolan tebal dinding dan bahan per bagian
Pengendalian tebal dinding parison, apakah oleh penggerak celah acuan hidraulik atau servoelektrik dengan program multipoint, secara langsung menentukan berapa banyak gram yang masuk ke setiap wadah. Pindah dari program tebal dinding 20-punt sampai 100-punt biasanya memungkinkan peningkatan 3 hingga 8 persen pada berat bagian saat kinerja beban penuh dan pengujian jatuh tetap terjaga. Karena SEC dinyatakan per kilogram, bagian yang lebih ringan tidak mengurangi SEC - tetapi mengurangi kilao tahunan total dan, pada 0,45 kWh/kg, sekitar
Udara Kompresi: Kelas Kedua yang Tenang dari Bekas Energi Pabrik Seluruh Indonesia yang Diimpor
Setiap program energi yang berhenti di kotak terminal mesin hanya akan menangkap sebagian dari penurunan yang tersedia. Udara kompresi dihasilkan secara sentral, dimetrikkan secara sentral, dan oleh karena itu jarang dihubungkan dengan mesin yang mengkonsumsinya, inilah mengapa ia tetap menjadi beban besar dan tak teratur di pabrik pembentukan tiup.
Sanksi pengonversi
Memproduksi udara kompresi dengan tekanan 7 bar membutuhkan sekitar 6-7 kW daya putar per meter kubik udara bebas yang dipasok per menit pada kompresor tangki yang terawat, dan meningkat menjadi 8 kW pada unit reciprocating yang lebih lama atau di mana filter intake kotor. Dari masukan tersebut, hanya sebagian kecil yang kembali diperoleh sebagai tenaga mekanis di titik penggunaan; sisanya menjadi panas pada kompresor dan penurunan tekanan dalam jaringan distribusi. Inilah sebabnya mengapa meter kubik udara kompresi yang dihemat di mesin bernilai jauh lebih banyak daripada energi yang sama yang dihemat pada motor listrik.
Keluarga
Kerugian udara bertekanan dalam pabrik pembuatan plastik yang tidak terkontrol biasanya berkisar antara 20 hingga 35 persen dari volume yang dihasilkan secara keseluruhan. Pabrik pembentukan tiup berada pada ujung terburuk dari rentang tersebut karena jumlah sambungan cepat, uni rotasi pada punggung aksi pendar, dan silinder pneumatik yang berurusan dengan siklus yang selalu berlangsung. Lubang tunggal berdiameter 3 mm pada tekanan 7 bar memiliki kerugian sebesar 0,5 meter kubik normal per menit, yang pada 6,5 kW per meter kubik per menit setara dengan sekitar 3,2 kW yang terus dibutuhkan, yaitu sekitar 25.600 kWh per tahun dengan 8.000 jam. Penyelidikan deteksi kerugian ultrasonik yang dilakukan dua kali setahun, dengan program perbaikan yang terdaftar, merupakan salah satu langkah dengan tingkat pengembalian tertinggi dan tingkat kesulitan yang rendah.
Manajemen rentang tekanan
Setiap penurunan 1 bar pada tekanan sistem mengurangi daya masuk kompresor sekitar 6 hingga 8 persen. Banyak pabrik EBM menjalankan seluruh kepala udara kompresi pada 8 atau 9 bar karena satu mesin membutuhkan angin celup bertekanan tinggi, sementara penguat khusus yang mengservis mesin tersebut akan memungkinkan kepala umum untuk turun hingga 6 bar. Memisahkan jaringan menjadi kepala tekanan rendah untuk penggerakan dan pengangkutan, dan cabang tekanan tinggi untuk angin keluar adalah langkah yang tidak terlalu sulit dengan hasil yang besar dan permanen.
Pendauran Panas dari Rumah Kompresor
Terdapat 70–90 persen energi masuk kompresor yang dapat didaur ulang sebagai energi panas berkelas rendah dalam aliran udara atau air pendingin. Di daerah dengan musim pemanasan, atau di pabrik dengan kebutuhan air panas untuk proses pencucian atau pengeringan resin, pemulihan energi tersebut akan mengurangi konsumsi energi lainnya. Hal ini tidak akan mengurangi pemeriksaan meter listrik untuk udara kompresi, namun mengurangi konsumsi energi di situs, yang merupakan angka yang penting untuk laporan karbon.
Langkah-langkah retrofit dan pembaruan yang disusun berdasarkan penghematan dan kesulitannya
750 kWh per tahun, secara independen dari pertanyaan arsitektur penggerak.
Tabel 5: Langkah-langkah pengurangan energi, daerah pengurangan dan tingkat kesulitan pemanfaatannya
| Measure | Energi blok terancam | Penghematan tipikal | Sulit dalam Implementasi | Jarak intensitas modal |
|---|---|---|---|---|
| Penelitian dan perbaikan kebocoran udara kompresi ultrasonik | Udara bertekanan | 10-25% energi udara | Rendah | Rendah |
| Jaket isolasi tegak dan kepala matriks | Pemanasan oleh ekstrusi | 15–25% energi pemanas | Rendah | Rendah |
| Penurunan suhu siaga selama berhenti | Pemanasan oleh ekstrusi | 30–50% dari energi pemanas siaga | Rendah | Rendah |
| Optimisasi set point air dingin (8-12°C jika siklus memungkinkan) | Air pendingin | 8-15% energi chiller | Rendah | Rendah |
| Staging tekanan udara eksploitasi (split pre-blow / hold) | Udara bertekanan | 20–35% dari volume udara yang dihasilkan | Rendah hingga Sedang | Rendah |
| Program penyegelan saluran pendingin pengaduk | Air pendingin | 5–12% energi chiller | Rendah hingga Sedang | Rendah |
| Dashboard SEC tingkat per shift dan sub-permetrian | Semua blok (pemenuhan) | 3–8% perilaku | Menengah | Rendah hingga Sedang |
| Penambatan baut penghalang dengan bagian pengaduk | Ekstrusi / plastik | 8–15% dari energi ekstrusi | Menengah | Menengah |
| Udara bertekanan network pressure split (low / high headers) | Udara bertekanan | Ditempa turun 6-8% | Menengah | Menengah |
| Pemulihan udara eksploitasi ke tangki intermediet | Udara bertekanan | 20–40% udara yang dikembalikan | Sedang hingga Tinggi | Menengah |
| Upgrade pompa servo pada unit daya hidrolik yang sudah ada | Standby hidraulik dan gerakan | 15-30% energi mesin | Sedang hingga Tinggi | Sedang hingga Tinggi |
| Drive kecepatan variabel pada chiller dan pompa pendinginan | Air pendingin | 15–30% energi pompa | Menengah | Menengah |
| Perbaikan pengontrol ketebalan dinding parison beberapa titik | Berat total yang diproses | 3–8% energi bahan dan pasanganannya | Sedang hingga Tinggi | Sedang hingga Tinggi |
| Penggantian lengkap dengan mesin EBM yang seluruhnya kering (all-electric) | Gerak, mode standby, pendinginan minyak | 25–45% dari energi sel (hingga 60% dibandingkan dengan kapasitas tetap lama) | Tinggi | Tinggi hingga premium |
| Pemulihan panas kompresor untuk mengolah air panas | Energi keseluruhan lokasi | 70-90% panas kompresor dapat dipulihkan | Tinggi | Sedang hingga Tinggi |
Aturan urutan yang masuk akal adalah untuk menyelesaikan semua langkah yang mudah sebelum memutuskan untuk menyelesaikan yang sulit. Ada dua alasan. Pertama, langkah-langkah yang mudah biasanya memberikan pengurangan total 10 sampai 18 persen dengan gangguan minimal. Kedua, dan yang paling penting, mereka membersihkan titik awal. Memperbaiki mesin sementara jaringan udara kompresi mengalami kebocoran 30 persen dan tangki-tangki tidak terisolasi membuat tidak mungkin untuk menentukan peningkatan yang terjadi dengan benar, yang mengganggu alasan untuk investasi berikutnya.
Mengkonversi Kilowatt-Hours menjadi Karbon: Statistik Grid
Seringkali, pabrik bunga plastik harus melaporkan emisi Scope 2 kepada pelanggan pemilik merek, dan di beberapa yurisdiksi kepada pengatur. Konversi dari kilowatt-hour (kWh) menjadi ekvivalen karbon dioksida menjadi hal yang sederhana setelah faktor emisi jaringan diambil, dan tonase yang dihasilkan seringkali menjadi angka yang lebih meyakinkan internal daripada angka energi saja.
Memilih Faktor Emisi pada Grid
Faktor emisi jaringan untuk listrik bervariasi secara luas antara negara dan tahun karena perubahan pembangkit listrik. Jangkauan yang dapat digunakan yaitu 0,55 hingga 0,85 kg CO2e per kWh mencakup sebagian besar jaringan industri dengan komponen pembangkitan yang sangat besar. Jaringan dengan penetrasi gas hidro, nuklir, atau energi terbarukan yang tinggi berada di bawah batas ini; jaringan yang didominasi oleh batubara berada pada atau sedikit di atas batas atas. Gunakan faktor nasional atau regional yang telah diterbitkan yang berlaku pada tahun laporan Anda, dan sebutkan sumbernya dalam disclaimer Anda. Jika pabrik memiliki perjanjian pembelian energi terbarukan, faktor berdasar pasar dapat digunakan bersamaan dengan faktor berdasarkan lokasi, sesuai dengan prosedur Gas Rumah Kaca.
Tabel 6 Equivalent: Pencapaian pengurangan emisi karbon berdasarkan kategori produksi
Penggunaan daerah pengurangan tersebut pada pengurangan kasus standar dari Tabel 4 menghasilkan penurunan emisi karbon sebagai berikut. Semua nilai dalam ton metrik sama dengan emisi karbon dioksida per tahun.
| Annual Output | Kasus | kW/thal Kilowatt-hour yang disimpan setiap tahun | Pada 0,55 kg CO2e/kWh | Dengan 0,70 kg CO2e/kWh | Dengan 0,85 kg CO2e/kWh |
|---|---|---|---|---|---|
| 500 t/tahun | Umum | 125,000 | 68,8 ton | 87,5 t | 106,3 t |
| 500 t/tahun | Kasus terbaik | 275.000 | 151,3 ton. | 192,5 t | 233,8 ton |
| 1.500 t/tahun | Umum | 375.000 | 206,3 ton | 262.5 t | 318,8 ton |
| 1.500 t/tahun | Kasus terbaik | 825.000 | 453.8 t | 577,5 ton | 701,3 t |
| 3.000 t/tahun | Umum | 750.000 | 412,5 t | 525,0 t | 637,5 t |
| 3.000 t/tahun | Kasus terbaik | 1.650.000 | 907,5 ton. | 1.155,0 t | 1.402,5 t |
Dikalkulasi per kilogram produk, kasus yang umum menghilangkan 0,25 kWh/kg, yang pada 0,70 kg CO2e/kWh menyimpulkan 0,175 kg CO2e per kilogram wadah yang diproduksi. Untuk pemilik merek yang melakukan penilaian siklus hidup pada format kemasan, angka tersebut dapat digunakan secara langsung dan perusahaan pengkonversi semakin dibutuhkan untuk menyediakannya. Kemampuan untuk menawarkan nilai SEC yang diukur dan intensitas Scope 2 per kilogram semakin menjadi persyaratan komersial dalam penawaran kemasan makanan, minuman, perawatan pribadi, dan obat-obatan.
Pengukuran dan Verifikasi: Menunjukkan Tingkat Penghematan pada Lantai Anda Sendiri
Penghematan yang dihitung adalah sebuah asumsi. Untuk mengubahnya menjadi hasil yang terbukti, perlu dilakukan protokol pengukuran yang lolos dari audit, dan protokol tersebut harus ditetapkan sebelum mesin berubah, bukan setelahnya.
Instrumentasi
Setelan minimum yang dapat diandalkan adalah alat pengukur kualitas listrik yang terdiri dari tiga fase pada pasokan yang masuk ke setiap mesin, yang mencatat energi aktif dalam kWh dengan interval satu menit atau lebih pendek, dengan perekam produksi yang mencatat bagian-bagian yang baik. Presisi kelas 1 cukup untuk manajemen energi; kelas 0,5S lebih diutamakan di mana data tersebut akan mendukung jaminan kinerja penyedia. Transformator arus harus disesuaikan dengan beban yang sebenarnya, bukan rating kabel, karena transformator arus yang terlalu besar yang mengukur mesin dengan beban yang ringan kehilangan akurasi pada ujung rendah rentangnya.
Instrumen lain yang menutupi biaya instalasinya: aliran meter dan pasangan suhu pada sirkuit pendinginan penanam untuk mengukur panas yang dikeluarkan, aliran meter udara di cabang mesin, serta hopper timbun resin atau penyedia kenaikan beban untuk memberikan kilogram yang benar yang diekstrusi, bukan kilogram yang disimpulkan.
Periode dasar
Dasar harus mencakup setidaknya empat minggu berturut-turut yang representatif dari produksi, yang mencakup campuran produk normal, setidaknya dua perubahan mould, dan pola pada hari kerja dan pada akhir pekan jika pabrik menjalankannya. Catat throughput dalam kilogram produk jualan, energi dalam kWh, dan kondisi operasi yang dapat menyesatkan perbandingan, yaitu suhu lingkungan, kelas resin, tingkat alur terbak, campuran produk menurut berat, dan setiap kerusakan mesin yang diketahui.
Normalisasi dan penyesuaian
Periode perbandingan setelah pemasangan harus dinormalisasi untuk apa pun yang berubah independen dari mesin. Faktor-faktor yang paling umum di blow molding ekstrusi adalah suhu lingkungan, yang mengubah beban pendingin antara musim panas dan musim dingin sebesar 10 hingga 25 persen, campuran produk, yang mengubah hubungan kilogram per siklus, dan perubahan kualitas resin, karena resin dengan tingkat aliran cair yang tinggi memerlukan pengurangan kerja shear. Pendekatan standar adalah regresi energi terhadap produksi dan hari-hari berdasarkan periode rujukan, kemudian menerapkan regresi tersebut untuk memprediksi apa yang akan dikonsumsi mesin rujukan diketahui berdasarkan kondisi periode laporan.
Waktu melaporkan.
Kinerja harus dilaporkan pada tingkat shift kepada operator, setiap minggu kepada manajemen produksi, dan setiap bulan kepada dewan. Transparansi pada tingkat shift adalah tempat penghematan perilaku antara 3 hingga 8 persen berasal: ketika operator dapat melihat bahwa membiarkan granulator berjalan selama pergantian cetakan tambal mengalami penambahan kWh yang dapat diukur, perilaku tersebut akan berubah tanpa perlu kebijakan yang ditulis. Pabrik yang mengimplementasikan pengukuran tetapi hanya memeriksanya setiap kuartal hanya mencatat sebagian kecil dari manfaat perilaku yang tersedia.
Apollo Sepenuhnya Elektrik EBM dalam praktek
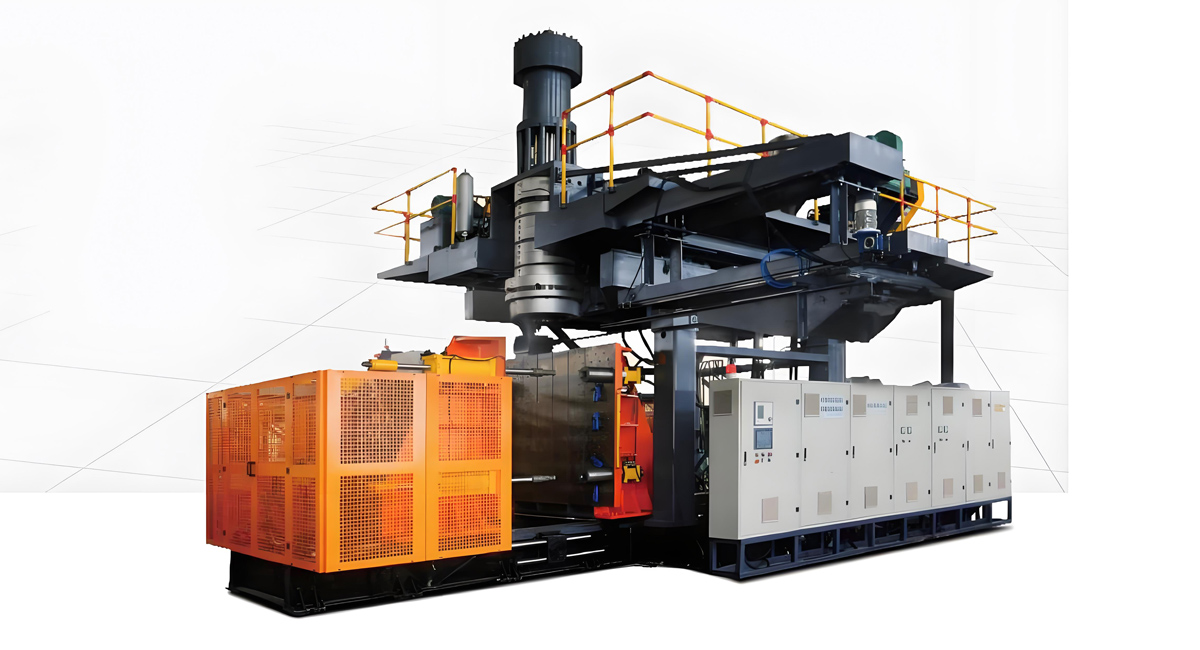
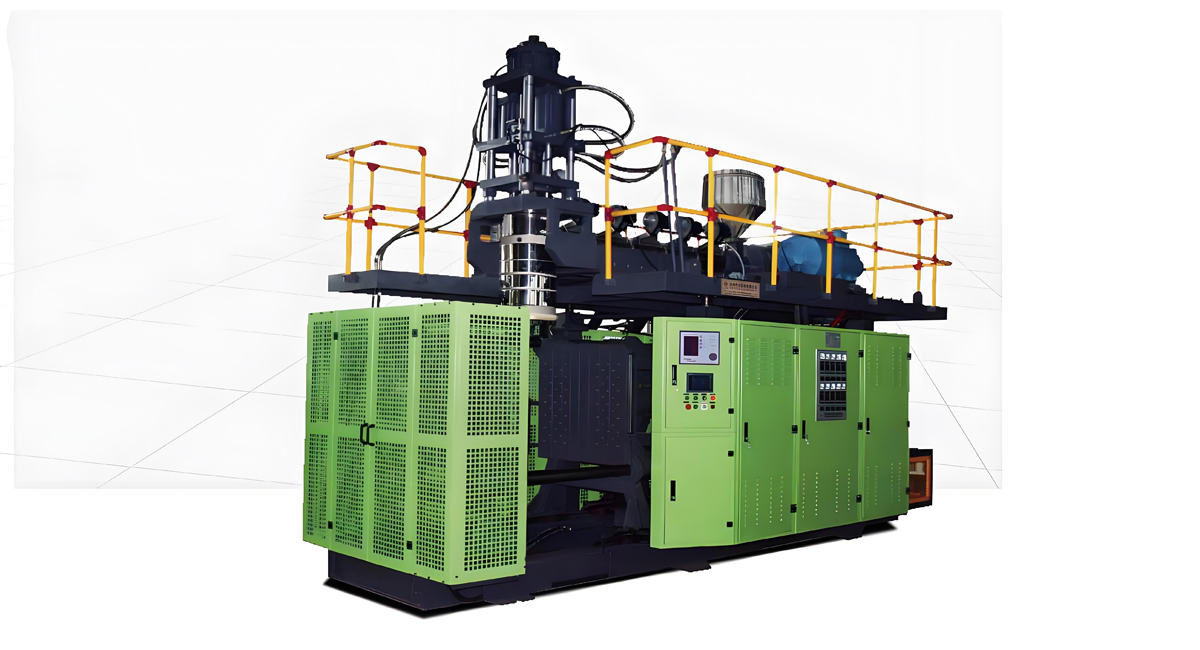
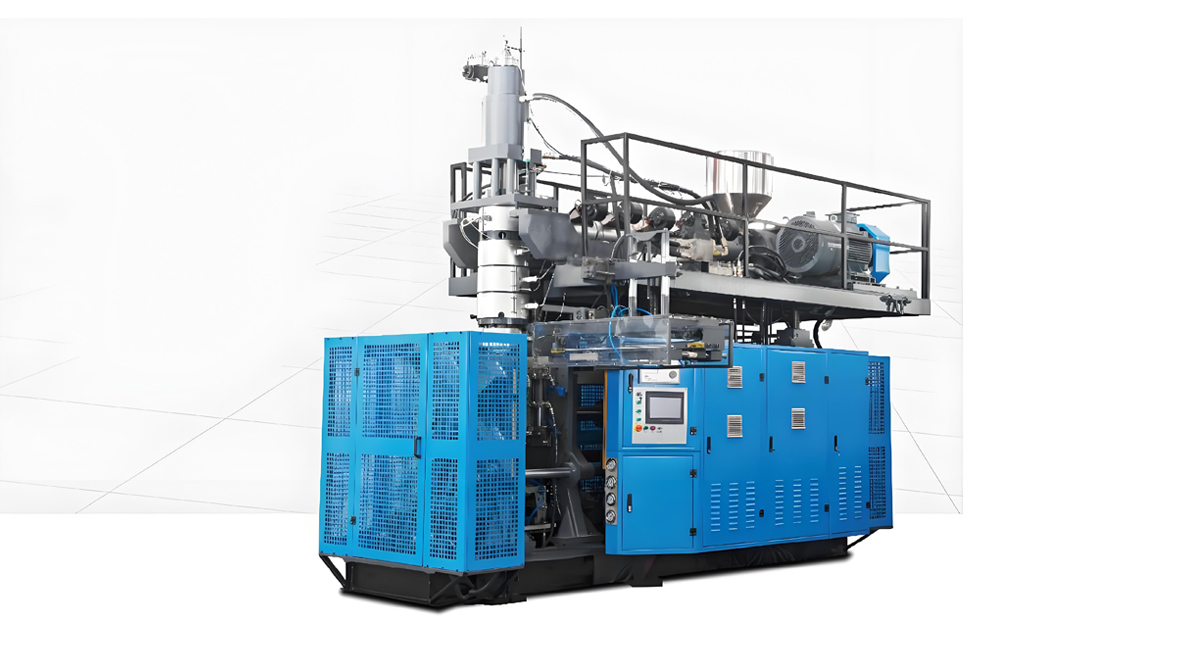
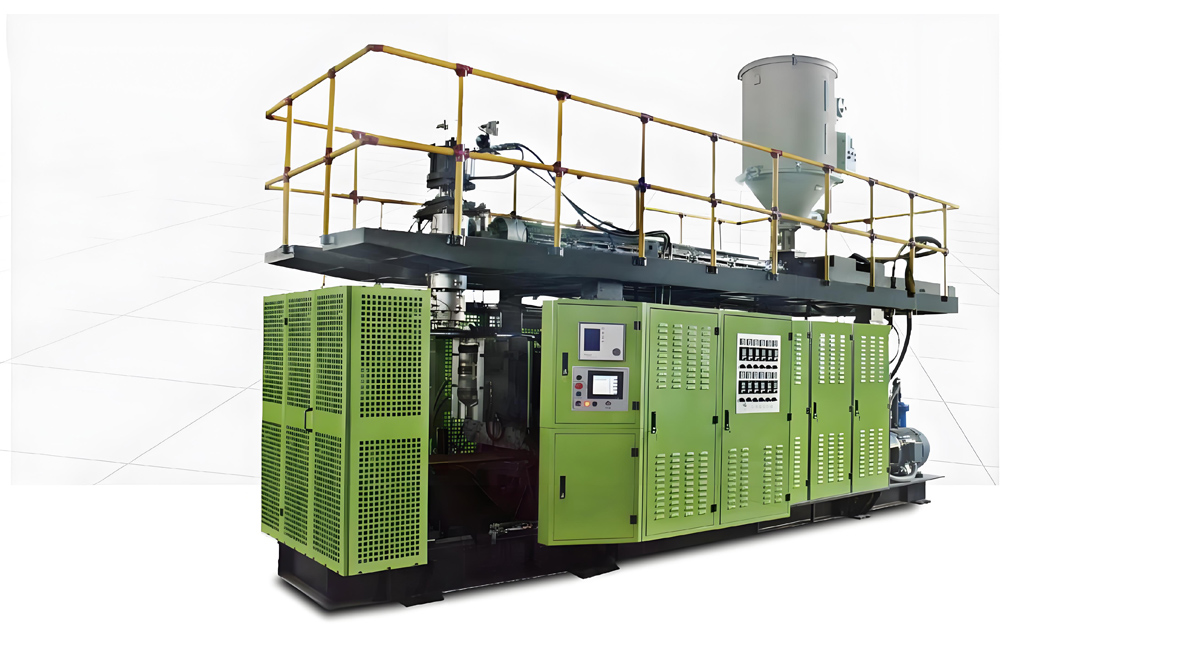
Apollo, pabrik Wanplas yang berbasis di Zhangjiagang dekat Shanghai, memproduksi sepuluh seri dan lebih dari delapan puluh model mesin blow molding ekstrusi otomatis, dengan lebih dari 4.000 mesin yang saat ini digunakan di lebih dari 90 negara. Produknya mencakup seri ABLB untuk wadah dari 200 ml hingga 20 L, seri ABLD untuk wadah besar dari 20 L hingga 1500 L, dan seri Full Electric yang mencakup dari 200 ml hingga 20 L untuk aplikasi di mana kinerja energi, kebersihan, dan rekombinasi menjadi persyaratan yang mengatur.
Perubahan dalam Seri Elektrik Maksimal
The Sepenuhnya Elektrik Series removes the hydraulic power unit entirely. Clamping, carriage traverse, blow pin actuation and extruder drive are all servo-electric. In energy terms this means the hydraulic standby block in Table 2 goes to zero, the clamping and motion block drops by roughly two thirds, and the oil cooling load disappears from the chilled water circuit. In operational terms it means no hydraulic fluid on the shop floor, no oil filter changes, no seal replacement schedule and no risk of oil contamination on food-contact or pharmaceutical containers — a material advantage for converters supplying medical and pharmaceutical customers, one of Apollo’s eight core application areas alongside food and beverage, daily chemical products, industri kimia, bahan bangunan, automotive, transportation and cultural and sports goods.
Mesin tersebut mengolah seluruh macam resin komersial dan teknis yang digunakan dalam proses blow molding ekstrusi, yakni PE, PP, PVC, PA, PC, ABS, PS, EVA, TPU, dan PETG. Karena servo drive menjaga profil kecepatan dan posisi secara terpisah dari suhu minyak, keborosan awal setelah pengoperasian dingin umumnya lebih rendah daripada hidraulik lainnya, di mana tiga puluh hingga enam puluh menit awal produksi dipengaruhi oleh pemanasan minyak dan penurunan yang berhubungan dengan respon katup.
Memilih Antara Arsitektur
Arsitektur yang serba elektrik bukanlah jawaban yang tepat untuk setiap aplikasi. Kontainer yang sangat besar dalam rentang ABLD dari 20 L hingga 1500 L memerlukan kekuatan penekanan yang tinggi dan peluncuran bertambah besar yang diaktifkan oleh penampungan, di mana arsitektur hidraulik atau hibrid sering menjadi solusi teknis yang lebih praktis, dan di mana siklus pekerjaan cukup berat sehingga kehilangan idle hidraulik membentuk bagian yang lebih kecil dari keseluruhan. Kasus yang paling kuat untuk arsitektur yang serba elektrik adalah segmen kontainer kecil hingga menengah yang sering dialokasikan, yaitu botol perawatan pribadi berukuran 200 ml hingga 5 L, botol pelumas, kontainer agrokimia, dan botol farmasi, di mana siklusnya singkat, peristiwa gerakan sering terjadi, faktor beban fluktuasi sesuai dengan pola pesanan, dan persyaratan kebersihan tinggi.
Apollo, Bekum, dan Kautex Maschinenbau semuanya menawarkan platform EBM sepenuhnya listrik atau hibrid di segmen ini, dan setiap evaluasi yang serius seharusnya membandingkan konsumsi energi khusus yang diamati pada protokol uji yang ditentukan dan identik, bukan membandingkan beban terhubung. Beban terhubung hanya mengatakan apa yang harus didukung oleh infrastruktur listrik; itu tidak mengatakan apapun tentang apa yang akan ditunjukkan meter.
Detail yang Memengaruhi Nilai SEC yang Ditemukan
Ketika menentukan mesin EBM yang seluruhnya beroperasi secara elektronik, pilihan-pilihan berikut memiliki dampak langsung dan kuantitatif pada SEC yang nantinya akan diukur:
- Isolasi kepala silinder dan matriks sebagai peralatan yang dipasang pabriknyaMemfilter energi pemanas sebesar 15 sampai 25 persen dari hari pertama, bukannya melakukan pengelolaan ulang (retrofit) yang dilakukan pada lebih lambat.
- Bus DC yang umum di semua sumbu servo, memungkinkan energi regeneratif dari sumbu yang melambat digunakan kembali daripada dibakar dalam resistor pengereman.
- Pengaturan tekanan pra-gelombang dan utama secara independen, enabling pressure staging without additional hardware.
- Penyusunan metering energi yang terintegrasi dengan keluaran data ke historis pabrik, sehingga SEC dapat didapatkan di tingkat shift tanpa perlu proyek metering yang terpisah.
- Logika stand-by setback.Itu secara otomatis menurunkan titik seting pemanas selama keadaan okupasi yang ditentukan dan mengembalikannya pada restart yang dijadwalkan.
- Pengaturan tebal dinding parison multi-titikDengan resolusi yang cukup untuk geometri wadah, berkurangnya kilogram per bagian.
- Pemilihan ukuran mesin yang tepatUntuk kondisi produk asli. Mesin yang terlalu besar menjalankan kontainer yang kecil membuang energi di setiap blok sekaligus, dan ini adalah kesalahan spesifikasi yang paling umum.
Layanan penyediaan mesin kustomisasi dari Apollo mencakup konfigurasi mould dan penyesuaian tegangan suplai, para insinyur melakukan instalasi dan pengaturan di tempat, dan mesin-mesin di inspeksi dan diuji sebelum dikirim. Komitmen tingkat grup Wanplas, termasuk hak untuk spare-part gratis setiap tahun, jaminan transportasi, jaminan kapasitas produksi, dan jaminan kualitas, berlaku di semua pabrik Wanplas. Kebijakan pabrik terbuka dari grup ini berarti pembeli potensial dapat menyaksikan mesin yang menggunakan resin dan mould mereka sendiri sebelum berkomitmen. Untuk konverter yang perhitungan energi bergantung pada peningkatan kapasitas produksi tertentu, pemeriksaan pabrik ditandatangani dengan pengukuran energi yang telah dirancang dalam protokol tersebut merupakan cara paling langsung untuk mengkonversi perkiraan ke komitmen kontrak.
Pertanyaan yang paling sering diajukan
Berapa konsumsi energi spesifik yang harus dicapai mesin EBM sepenuhnya saat memutar HDPE?
Untuk wadah HDPE multipurpose antara 200 ml dan 5 liter, mesin pembentukan tiup ekstrusi sepenuhnya listrik yang sesuai ukurannya harus menghabiskan antara 0,35 dan 0,55 kWh setiap kilogram produk jualan di kotak terminal mesin dengan isolasi kerucut yang dipasang dan faktor beban di atas 0,65. Angka pada ujung bawah daerah tersebut membutuhkan kontrol ketebalan dinding yang baik, suhu cair pada ujung bawah jendela 175-210oC, dan waktu tenaga yang tidak produktif minimal. Jika pengukuran Anda melebihi 0,60 kWh/kg pada mesin sepenuhnya listrik, lakukan penyelidikan tentang isolasi kerucut, perilaku siaga, titik set chiller, serta pengukuran mesin sebelum mempertanyakan arsitektur penggerak.
Bagaimana saya menghitung pengurangan kWh tahunan saya sendiri tanpa harus membeli mesin terlebih dahulu?
Instal meter energi tiga-fase pada satu mesin yang ada, log energi dan kilogram yang dapat dijual selama empat pekan berurutan, dan bagi hasilnya untuk mendapatkan kelengkapan konsumsi energi dasar Anda. Kaliikan perbedaan antara kelengkapan dasar tersebut dengan target 0,45 kWh/kg dengan total angka tonase yang dapat dijual per tahun dalam kilogram. Misalnya, kelengkapan dasar 0,72 kWh/kg pada pabrik yang menghasilkan 1.200 ton per tahun memberi penghematan (0,72 – 0,45) × 1.200.000, yang sama dengan 324.000 kWh per tahun. Gunakan struktur tarif Anda sendiri untuk angka tersebut terpisah; produk pengerjaan tekniknya adalah angka kilo watt-jam.
Apakah retrofit pompa servo merupakan alternatif yang masuk akal dibandingkan dengan membeli mesin yang sepenuhnya listrik?
Ini merekam bagian yang berarti dari manfaat pada tingkat kesulitan implementasi sedang hingga tinggi dan intensitas modal sedang hingga tinggi. Perbaikan pompa servo pada unit daya hidraulik yang berkualitas biasanya memberikan pengurangan energi mesin antara 15 dan 30 persen dengan mengatasi kerugian idle dan bypass, yang merupakan kerugian hidraulik terbesar yang dapat dihindari. Hal ini tidak menghilangkan pengurangan lebar katup, kebocoran jumlah, beban pendinginan oli, atau perawatan hidraulik. Sebagai aturan umum, perbaikan merupakan pilihan yang lebih baik untuk mesin dengan masa pakai mekanik yang signifikan dan campuran produk yang stabil; penggantian merupakan pilihan yang lebih baik ketika mesin mendekati akhir masa pakainya, di mana kebersihan menjadi faktor penting, atau ketika campuran produk menyebabkan faktor beban fluktuatif secara besar-besaran.
Apakah penggerak listrik sepenuhnya mengurangi konsumsi udara kompresi?
Nomor. Siklus angin pemanasan, angin pemanasan prematur, pembuangan, dan pengerahan pneumatik tidak terpengaruh oleh arsitektur penggerak sistem pemerasan dan ekstrusi, dan udara kompresi masih menyumbang 10 hingga 20 persen dari jejak energi sel. Udara kompresi harus ditangani dengan langkah-langkah khusus: pemeriksaan kebocoran, pengaturan tekanan antara tahap pemanasan prematur dan tahap penahan, pengapuran tekanan jaringan, dan pemulihan pembuangan udara pemanasan ke tangki intermediat. Karena pembuatan udara kompresi tidak efisien, langkah-langkah ini sering menghasilkan hasil yang setara dengan pemadaman listrik pada intensitas modal yang jauh lebih rendah.
Seberapa banyak isolasi tabung yang sebenarnya dapat menghemat biaya pada mesin pemekatan diarsir?
Jaket isolasi yang dapat dilepas di atas silinder dan kepala cetakan mengurangi energi pemanas sebesar 15 sampai 25 persen, dengan jumlah yang lebih tinggi berlaku untuk mesin yang beroperasi di lapangan produksi yang berangin atau ruangan ber-AC dengan perbedaan suhu yang terbesar dengan suhu ruang. Sebab pemanasan ekstrusi dan plastikasi berperanan 35 sampai 45 persen dari total energi sel, hal ini menyiratkan sekitar 5 sampai 11 persen dari total energi sel. Kesulitan implementasinya rendah, jaket dapat dipasang selama jendela pemeliharaan yang direncanakan, dan manfaat sekunder bentuk temperatur zona yang lebih stabil dan waktu pemanasan yang lebih cepat dari suhu dingin layak dimiliki terlepas dari hasil energi.
Mengapa dua mesin yang identik di pabrik yang sama menunjukkan konsumsi energi spesifik yang berbeda?
Penyebab yang paling umum, berdasarkan frekuensi, adalah: faktor beban yang berbeda karena satu mesin memproduksi produk yang lebih berat; jam non-prodiktif yang diferensiasi karena satu mesin tidak aktif saat terjadi penempatan piringan tetapi tetap menyala; kondisi sirkulasi air dingin yang berbeda, di mana satu pembentukan memiliki saluran pendingin yang tersumbat yang menyebabkan siklus yang lebih lama; kondisi kepala paku atau paku yang berbeda, di mana paku yang rusak menghasilkan panas pemotongan yang berlebihan yang harus diatasi oleh pendinginan tabung; dan set points temperatur puncak yang berbeda yang diwariskan dari resep lama yang tidak pernah diubah. Pengukuran sub-metrik baik pada mesin dan perbandingan window empat minggu yang sama biasanya menemukan penyebab dalam satu siklus pelaporan.
Apakah ringannya kontainer mengurangi konsumsi energi tertentu?
Tidak secara langsung, karena SEC diukur per kilogram dan berat bagian yang lebih ringan hanya berarti jumlah kilogram yang lebih sedikit. Yang dikurangi oleh bobot yang lebih ringan adalah total kilowatt-hour per tahun, proporsional kepada massa yang dihilangkan. Penurunan berat bagian sebesar 5 persen pada sebuah pabrik yang memproduksi 1500 ton per tahun menghilangkan 75 ton throughput, yang pada 0,45 kWh/kg menghilangkan sekitar 33.750 kWh per tahun bersama dengan resin yang sesuai. Ringan dan elektrikasi oleh karena itu lebih berlainan daripada perbandingan yang bersaing, dan pemrograman tebal dinding seris multi-poin yang diperlukan untuk yang pertama umumnya tersedia pada mesin yang ditentukan untuk yang kedua.
Faktor emisi jaringan mana yang harus saya gunakan untuk laporan Scope 2?
Perbandingan Manfaat Relatif Bulk vs Tunggal
Sejauh berapa lama harus berjalan baseline pengukuran dan verifikasi sebelum melakukan pergantian mesin?
Empat minggu berturut-turut adalah minimum yang praktis, dan delapan minggu lebih disarankan bila komposisi produk berubah setiap bulan. Dasar harus mencakup setidaknya dua perubahan cetakan, mulai dari kondisi dingin dan restart pada suhu sedang, serta distribusi ukuran kontainer yang normal. Catat suhu lingkungan bersama dengan energi dan produksi sehingga perbandingan setelah dipasang dapat dinormalkan untuk beban kompresor musim, yang biasanya berubah 10 sampai 25% antara musim panas dan musim dingin dan dapat mengganggu efek yang diukur.
Kesimpulan
Kurangnya listrik per tahun yang dapat dicapai dengan beralih dari ekstrusi hidraulik ke pembentukan tiup yang sempurna secara elektris bukanlah masalah pendapat; itu adalah keuntungan aritmatika yang dihasilkan dari dua angka yang dapat diukur. Ukur konsumsi energi spesifik saat ini dalam unit kilowatt jam per kilogram produk yang bisa dijual dalam jangka waktu empat minggu yang representatif, tentukan tujuan yang dapat ditetapkan dalam kisaran 0,35 hingga 0,55 kWh/kg untuk operasi yang sempurna secara elektris pada PET, kalikan perbedaan tersebut dengan tonase penjualan tahunan dalam kilogram, dan Anda telah mengetahui jawabannya. Dengan 500 ton per tahun, kasus umum menghilangkan 125.000 kWh per tahun; dengan 1.500 ton, menghilangkan 375.000 kWh; dengan 3.000 ton, menghilangkan 750.000 kWh. Dihitung sebagai indeks terhadap basis 100, pabrik yang sempurna secara elektris berjalan pada sekitar 64 indeks, dan berlawanan dengan armada lama dengan kapasitas tetap dan faktor beban rendah, dapat turun di bawah 40.
Mekanisme di balik angka-angka tersebut akurat dan fisik: menghilangkan kerugian bypass pompa yang tetap ada selama 70 hingga 85 persen dari setiap siklus, menghilangkan konsumsi peralatan standby hidraulik selama 400 hingga 800 jam tanpa produktif yang dihidupkan dalam satu tahun yang biasa, menghilangkan beban pembersihan minyak dari sirkuit air dingin, dan memulihkan sebagian energi penurunan kecepatan melalui gerbang DC umum. Elektrifikasi tidak dapat mengurangi pemanasan, udara kompresi, pendinginan bubuk, atau beban tambahan, yang bersama-sama mewakili lebih dari setengah lahan sel – dan itulah sebabnya program berjangka dalam Tabel 5 penting. Selesaikan tindakan-tindakan yang relatif mudah terlebih dahulu, bersihkan dasar, kemudian buat keputusan arsitektur dengan data yang andal.
Apollo, pabrik Wanplas dengan pengalaman lebih dari dua puluh tahun dalam proses ekstrusi blow molding dan fasilitas seluas 8.000 meter persegi di Zhangjiagang, memproduksi Seri Sepenuhnya Elektrik untuk segment yang tepat, yaitu dari 200 ml hingga 20 L, di mana mekanisme kerugian ini paling besar dan kasus pengoptimasian energi paling kuat. Bawa resin, cetakan, dan target SEC Anda sendiri ke tes penerimaan pabrik yang disaksikan, tegaslah bahwa pengukuran energi menjadi bagian dari protokol pengujian, dan konversikan penghematan yang direncanakan menjadi yang telah diverifikasi sebelum mesin dikirim. Itulah perbedaan antara penghitungan energi dengan hasil energi.