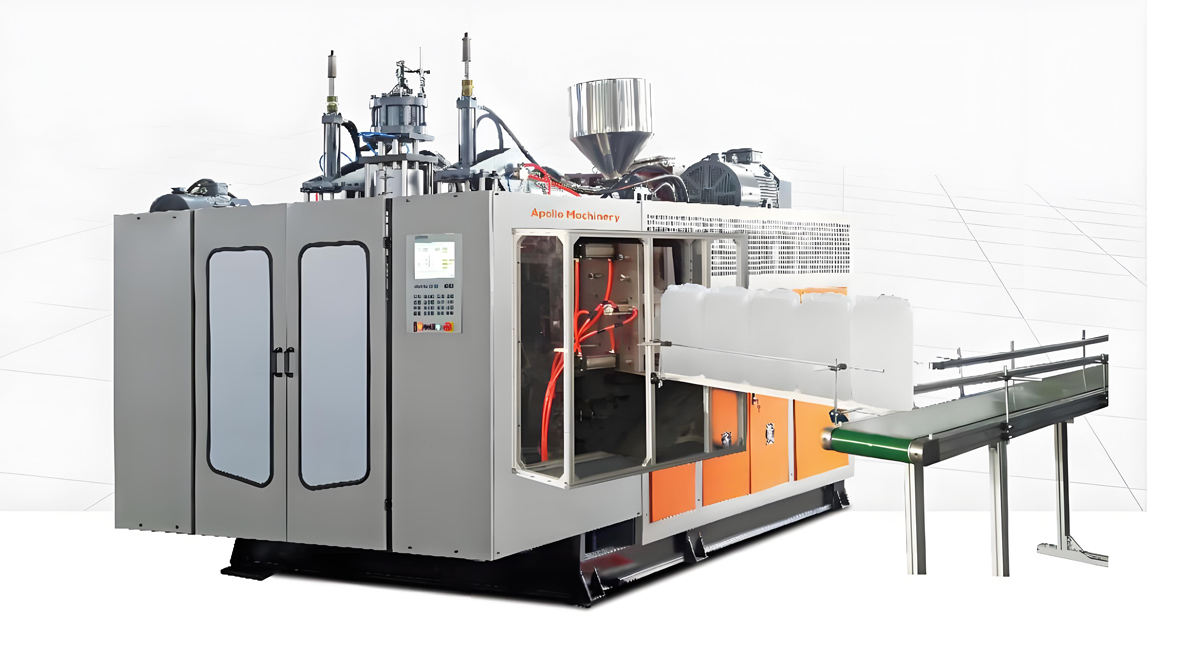

Choosing a 20L extrusion blow molding machine is rarely decided by the sticker price of the main frame alone. For global buyers serving the chemical, lubricant, food, and industrial packaging markets, the purchase invoice represents only the visible tip of a much larger five-year financial commitment. The real financial picture is defined by total cost of ownership, a structured accounting of every cost the machine generates from the day it is installed until the day it is retired or replaced. This article breaks that ownership cost into its five structural domains, quantifies each as an indexed share of a 100-point baseline, and traces how the cost mix shifts from capital-heavy in year one toward operating-heavy by year five. Whether you source from Apollo, a Wanplas factory specializing in extrusion blow molding machines, or from a competitor in Europe, North America, or Asia, the framework below lets you compare proposals on equal footing without ever needing a single currency figure.
Understanding the 20L Extrusion Blow Molding Machine and Its Cost Drivers
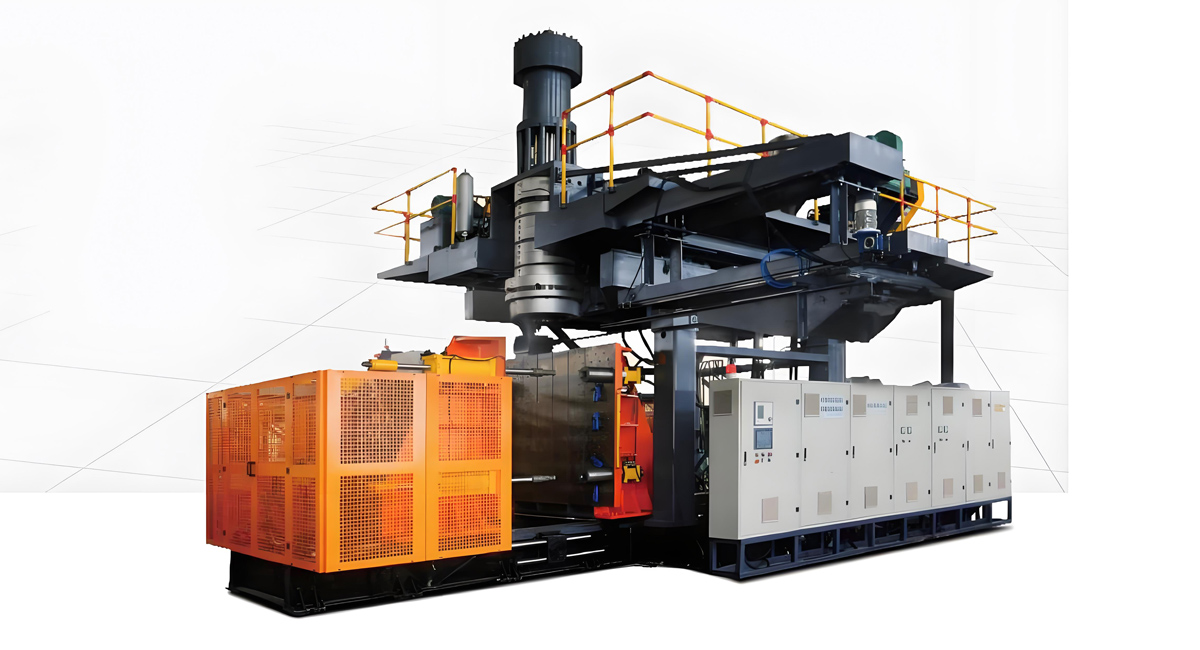
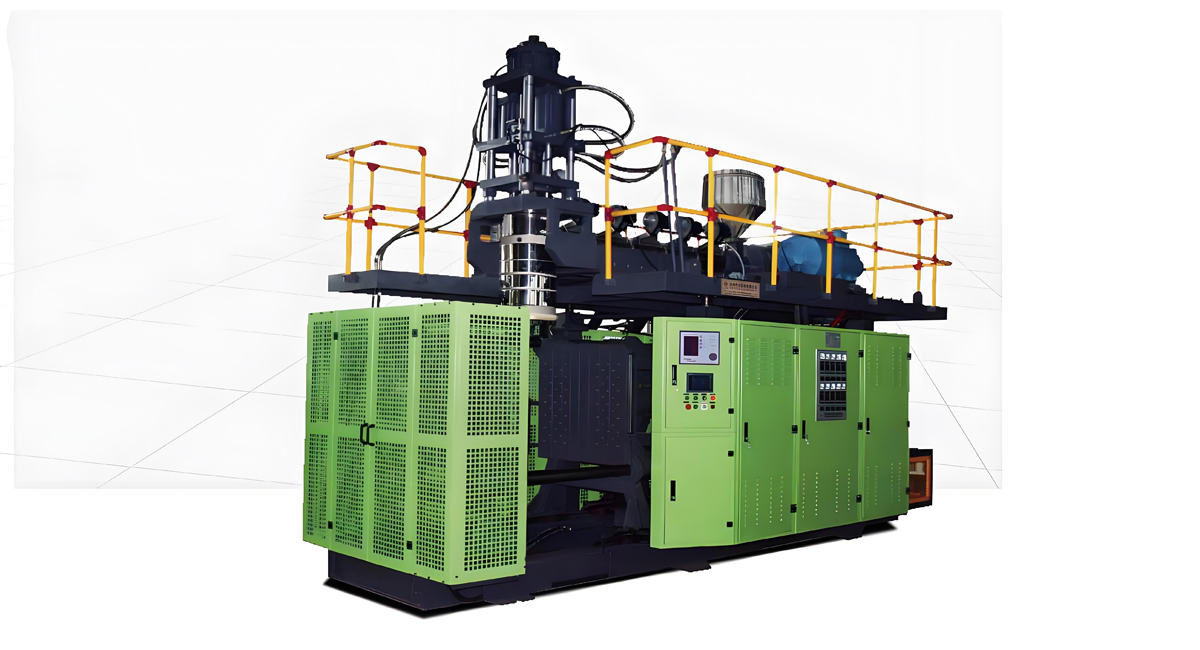
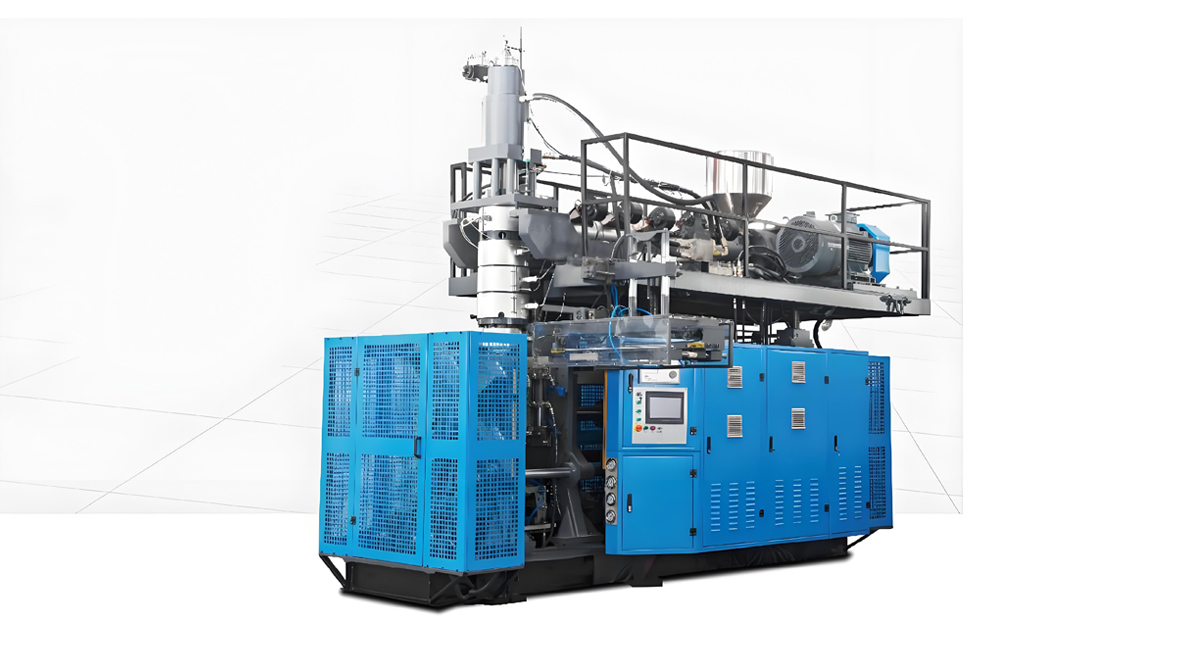
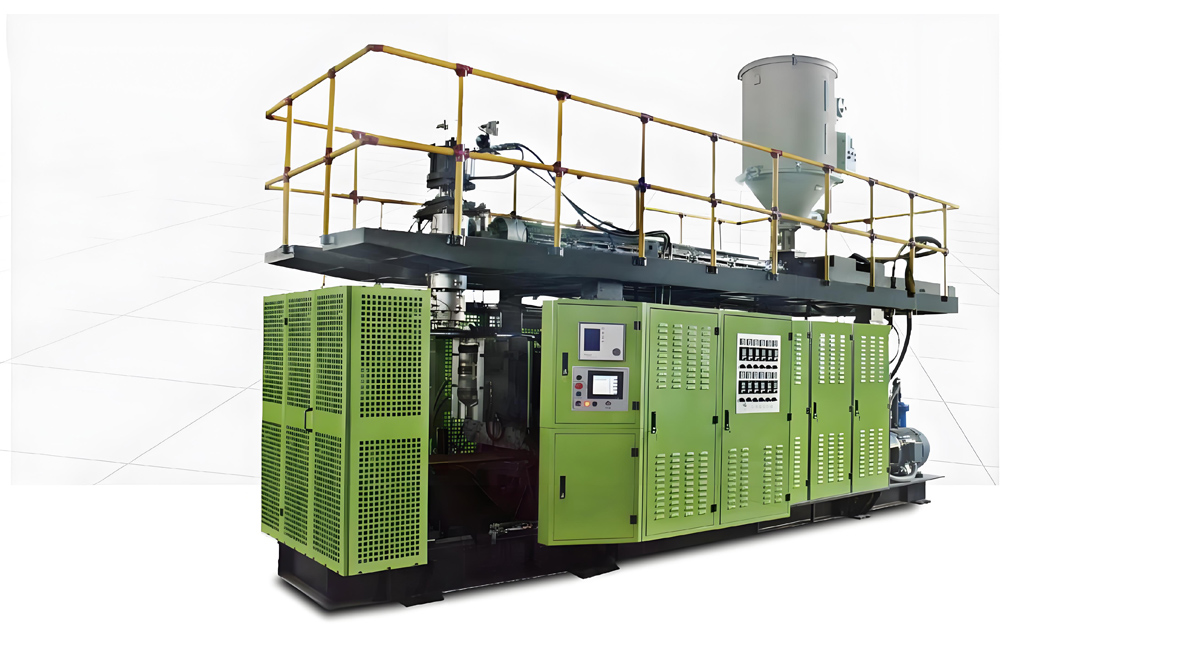
A 20L extrusion blow molding machine, commonly abbreviated as a 20L EBM machine, is a continuous or accumulator-fed hollow molding system that extrudes a molten tube of polymer called a parison, captures it between two mold halves, and inflates it with compressed air into a container such as a jerry can, a chemical pail, or a stackable storage vessel. The 20L class sits in the middle of the industrial blow molding range: smaller than the heavy-duty L-ring drum lines yet far larger and more energy-intensive than the small daily-chemical bottle machines that occupy the 200mL to 5L segment.
The technical specification of the machine is the single largest determinant of every downstream cost domain. A machine configured with a larger screw, a higher installed power, and an accumulator head will carry a higher CAPEX index but may deliver lower unit energy and higher output, which reshapes the five-year balance. Before any cost can be modeled, the buyer must lock down the core configuration parameters that the supplier will quote against.
| Reference Parameter | Typical 20L EBM Range | Cost Sensitivity |
|---|---|---|
| Station configuration | Single station / Double station | Double station raises CAPEX index, lowers unit energy index |
| Head type | Accumulator head vs Continuous extrusion | Accumulator head favors thick-wall and large parison; higher hydraulic index |
| Screw diameter | Phi 90 mm to Phi 120 mm | Larger screw raises throughput and installed power index |
| L/D ratio | 25:1 to 30:1 | Higher L/D improves plasticizing homogeneity, raises barrel cost |
| Output (20L HDPE jerry can) | 60 to 120 pcs/h | Higher output amortizes CAPEX and labor across more units |
| Part weight | 700 to 1100 g | Directly drives material and energy consumption index |
| Installed power | 90 to 160 kW | Primary driver of energy cost domain |
| Clamping force | 180 to 400 kN (by platen size) | Insufficient clamping force raises flash and scrap index |
The clamping force, measured in kilonewtons, must be matched to the projected parison area and the internal blow pressure. For a 20L container the mold-opening force scales with the cavity surface, and under-specifying clamping force is a classic source of flash, dimensional drift, and elevated scrap rates. Apollo, a Wanplas factory with more than 20 years of experience and over 4,000 machines running in more than 90 countries, sizes its ABLB and ABLD series around this relationship so that the blow mold and the clamping unit are engineered as one matched system rather than as separately purchased components.
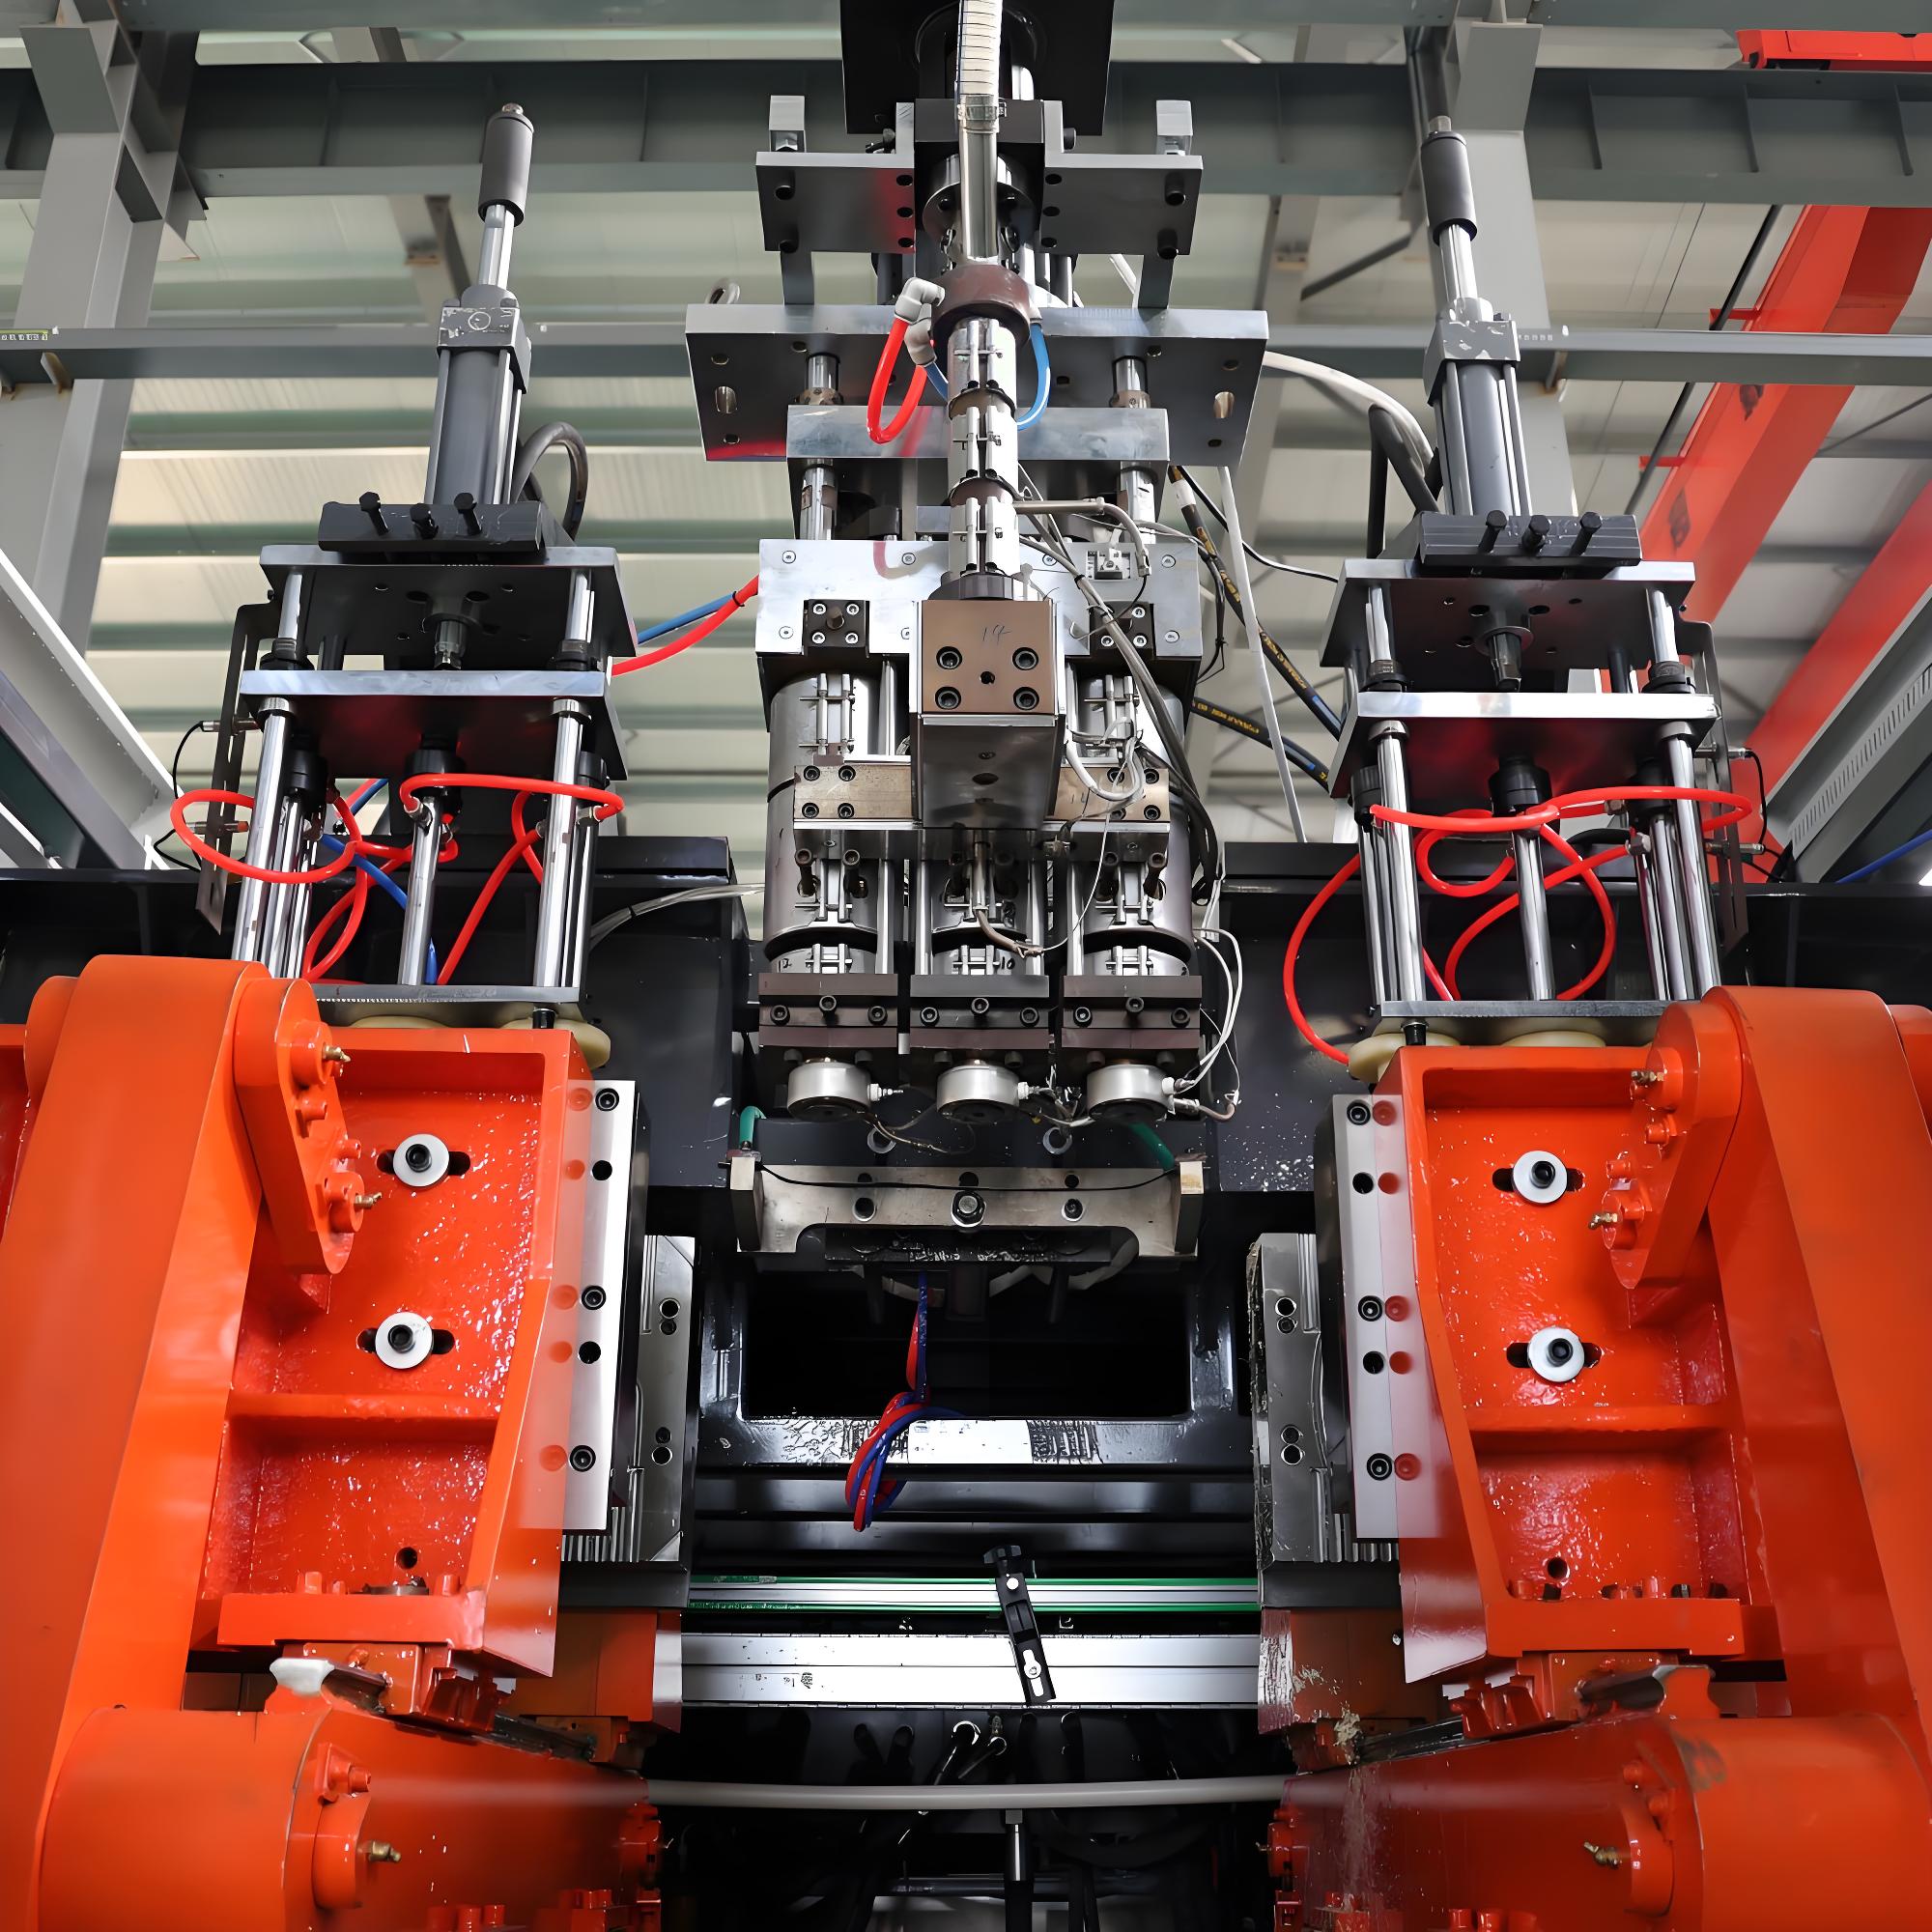
Two head architectures dominate the 20L class. Continuous extrusion feeds a steady parison into an open mold and is favored for stable, repeatable production of containers in the lower part of the size band. The accumulator head stores a measured shot of melt and releases it rapidly to form a large parison in one motion, which is essential for thick-wall 20L chemical pails and for minimizing parison sag and wall-thickness variation. The accumulator design adds hydraulic accumulator volume and a more elaborate die head, which lifts both the CAPEX and the auxiliary energy index, but it protects part quality on demanding applications where continuous extrusion would struggle.
The Five Cost Domains of Total Cost of Ownership
Total cost of ownership for a 20L extrusion blow molding machine is best understood as five superimposed cost domains that scale at different rates over the ownership horizon. The first domain is incurred once; the remaining four accrue continuously and compound with production volume. Treating them as one blended number hides the levers that actually move the result.
The five TCO domains are CAPEX, energy, labor, maintenance and spare parts, and scrap plus downtime loss. In a typical five-year ownership model for a double-station 20L EBM machine, CAPEX is a one-time event while the other four domains grow every operating hour.
To remove currency from the comparison entirely, this article normalizes a reference configuration to a TCO index baseline of 100 index points spanning the full five-year horizon. The reference configuration is a double-station 20L extrusion blow molding machine with an accumulator head, a single-screw extruder of 100 mm diameter and L/D 28:1, a variable-pump hydraulic clamping system, an annual operation of 6,000 hours at 82% overall equipment effectiveness, producing a 900 g HDPE jerry can. Every cost domain is then expressed either as an index share, a percentage of total five-year cost, or a relative level from the scale Low, Medium, High, Very High, to Premium.
| Cost Domain | Index Share (of 100) | % of 5-Year TCO | Relative Level | Accrual Pattern |
|---|---|---|---|---|
| CAPEX (one-time) | 26 | 26% | High | Year 0, single event |
| Energy | 31 | 31% | Very High | Linear with run hours |
| Labor | 18 | 18% | Medium | Linear with shifts |
| Maintenance & spare parts | 12 | 12% | Medium | Front-loaded in later years |
| Scrap & downtime loss | 13 | 13% | Medium | Variable, quality-linked |
| Total | 100 | 100% | — | — |
Energy is the dominant recurring domain at 31 index points, which surprises first-time buyers who expect the machine price to dominate. The reason is simple: a 20L EBM machine runs a 90 kW to 160 kW extruder and a hydraulic clamp for thousands of hours per year, and the cumulative electricity index dwarfs the one-time frame cost once production volume is realistic. Labor sits at 18 index points for a semi-automated line with one to two operators per shift, while maintenance and scrap occupy the remainder. The exact balance shifts by region, by drive technology, and by how aggressively the buyer recovers flash and trims scrap, which the later sections quantify.
CAPEX Breakdown: Machine, Mold, Auxiliaries, Installation, Logistics
CAPEX is the only domain that does not recur, but it sets the ceiling for every other domain because the machine design and the mold quality determine energy, labor efficiency, and scrap. Within CAPEX, five sub-components should be quoted separately rather than accepted as a single lump sum, because suppliers bundle them differently and a low headline machine price often hides a thin mold or absent auxiliaries.
| CAPEX Sub-Component | Index Share (of 100) | % of Total CAPEX | Relative Level |
|---|---|---|---|
| Main machine (frame, extruder, head, clamp) | 16 | 62% | High |
| Blow mold set (cavity, neck, cooling) | 5 | 19% | Medium |
| Auxiliaries (chiller, air compressor, crusher, leak tester) | 3 | 12% | Medium |
| Installation & commissioning | 1.2 | 5% | Low |
| Sea freight & import tariff | 0.8 | 3% | Low to Medium |
The main machine absorbs roughly 62% of CAPEX. Within that figure, the extruder and the accumulator head are the most expensive sub-assemblies because they concentrate the precision barrel and screw, the die head, and the hydraulic power unit. Specifying a larger screw such as Phi 120 mm versus Phi 90 mm lifts the machine index but expands the viable part-weight envelope from 700 g up toward 1100 g and beyond, which can be the difference between qualifying for a tender and being excluded.
The blow mold is a frequently underestimated line item. A 20L jerry can mold demands hardened steel cavities, efficient internal cooling channels, and a precisely machined neck insert to hold UN 1H1 hazardous-goods tolerances. A mold quoted at a Low relative level may lack sufficient cooling circuit density, which silently raises cycle time and therefore energy and labor indices for the entire five years. The Wanplas brand’s shared quality standard, which Apollo applies to its mold packages, is to validate the mold on the machine before shipment rather than shipping a cold tool, a practice that protects the buyer from a hidden rework cost domain.
Auxiliary equipment is the third CAPEX sub-component and is often omitted from a bare machine quote. A 20L line requires a chiller to stabilize the mold and hydraulic oil temperature, an air compressor sized for the blow pin and parison cut, a crusher or granulator to recover flash and reject parts, and a leak tester for pressure or vacuum verification of the finished container. The chiller and compressor also appear again in the energy domain, so their selection must be optimized for both CAPEX and recurring consumption. Installation and commissioning typically represent a Low index share but carries schedule risk: a delayed commissioning pushes the entire revenue start and inflates the implicit cost of idle capital. Sea freight and import tariff vary widely by destination and by whether the machine is crated as a complete unit or in knocked-down form, landing in the Low to Medium band depending on the buyer’s region.
Energy Consumption and Specific Energy Modeling
Energy is the largest recurring cost domain for a 20L EBM machine, and it is the most controllable through specification choices. The right metric is specific energy consumption, defined as the electricity drawn per kilogram of finished container. For the 20L HDPE jerry can class, specific energy consumption falls in the range of 0.35 to 0.55 kWh per kilogram of through-put, with the lower end achieved by all-electric or well-tuned servo-hydraulic machines and the upper end typical of older fixed-speed hydraulic designs.
To translate this into an indexed cost, consider the reference 900 g container at 90 pieces per hour, 6,000 operating hours per year, and 82% OEE. The effective annual through-put is approximately 390,000 kg of finished goods. At a specific energy consumption of 0.45 kWh/kg, the machine consumes roughly 175,000 kWh per year. At the lower 0.35 kWh/kg figure the same output drops to about 137,000 kWh per year, a reduction of more than 20% that compounds across five years and across every region’s tariff structure. The takeaway is that the energy domain, not the machine price, is where the five-year gap between a well-specified and a poorly specified line becomes largest.
| Drive / Head Combination | Specific Energy (kWh/kg) | Energy Index (baseline 31) | Relative Level |
|---|---|---|---|
| Fixed-speed hydraulic, continuous extrusion | 0.50 to 0.55 | 34 to 36 | Very High |
| Variable pump hydraulic, accumulator head | 0.42 to 0.48 | 29 to 31 | High |
| Servo-hydraulic, accumulator head | 0.38 to 0.44 | 26 to 29 | Medium |
| All-electric (servo motor driven) | 0.35 to 0.40 | 24 to 27 | Low to Medium |
Beyond the drive system, three operational factors move specific energy consumption. First, part weight: a 700 g container consumes proportionally less electricity than a 1100 g container for the same piece count, so over-specifying wall thickness inflates the energy domain for no functional benefit. Second, OEE: every hour of unplanned downtime or slow cycle still draws standby and conditioning load while producing nothing, so the effective specific energy consumption rises as OEE falls. Third, ambient and cooling conditions: a chiller struggling against a hot climate or a poorly insulated hydraulic tank forces the extruder to work harder to hold melt temperature, lifting the index. Buyers in high-ambient regions should treat chiller capacity as a first-order energy decision, not an afterthought.
Drive System Comparison: Servo-Hydraulic vs Variable Pump vs All-Electric
The clamping and extrusion drive architecture is the central energy lever for a 20L EBM machine, and it is also the clearest example of a CAPEX-versus-operating-cost trade-off. Three mature architectures compete in this class, and each shifts the five-year cost mix in a predictable direction.
| Attribute | Variable Pump Hydraulic | Servo-Hydraulic | All-Electric |
|---|---|---|---|
| CAPEX relative level | Medium | High | Premium |
| Energy index (of 31 baseline) | 29 to 31 | 26 to 29 | 24 to 27 |
| Energy saving vs baseline | Baseline | 8% to 16% | 25% to 40% |
| Hydraulic oil consumption | Medium | Low | None |
| Cleanroom / food suitability | Limited | Good | Excellent |
| Maintenance index | Medium | Medium | Low |
| Best-fit application | General chemical pails | High-volume industrial | Food, pharma, clean |
Variable pump hydraulic is the volume baseline for the 20L class. It trims flow to demand and avoids the constant motor load of a fixed-displacement unit, landing near the 31-point energy index. Servo-hydraulic replaces the fixed motor with a servo motor and closed-loop pressure control, cutting energy by a multiple of roughly 0.84 to 0.92 relative to the baseline while retaining the high clamping force and ruggedness that thick-wall 20L parts need. All-electric removes the hydraulic power unit entirely, driving the clamp and the extruder feed through servo motors, and delivers the 25% to 40% energy saving referenced in the brief. The penalty is a Premium CAPEX level and, for very large accumulator heads, a practical limit on clamping force, which is why all-electric is most common in the 200mL to 20L food and pharmaceutical segment rather than in the heaviest drum applications.
The decision rule is straightforward: if the application is food, pharmaceutical, or demands the lowest possible operating cost and clean operation, the Premium CAPEX of all-electric is recovered through the energy and maintenance domains over five years. If the application is general chemical pails at high volume, servo-hydraulic captures most of the saving at a lower CAPEX premium. Variable pump remains the rational choice where upfront budget dominates and energy tariffs are low. Apollo’s fully electric series and its ABLB series both serve the 200mL to 20L band, giving the buyer a like-for-like architecture switch without changing supplier.
Labor, Maintenance, and Spare Parts Replacement Cycles
The labor domain covers operators, material handling, quality inspection, and supervision across the shifts the line runs. For a semi-automated 20L line producing 60 to 120 pieces per hour, the typical staffing is one to two operators per shift, with a leak tester and a crusher reducing manual handling. Moving from a single shift to a three-shift pattern multiplies the labor index by roughly a factor of three while barely changing the energy-per-unit, because the machine is already amortized across more output. This is why shift pattern is a first-order TCO lever: at three shifts the labor domain rises but the CAPEX and energy-per-unit fall, improving the blended index.
Maintenance and spare parts is the domain that becomes more expensive in the later years of ownership, because wear components reach their replacement thresholds on a schedule that clusters around years two through five. Planning this domain in advance prevents the panic-buying and extended downtime that inflate it unexpectedly. The table below maps the standard replacement intervals for a 20L EBM machine running HDPE.
| Component | Replacement Interval | Cost Level | Impact if Neglected |
|---|---|---|---|
| Screw and barrel | 5 to 8 years | High | Rising energy, poor melt homogeneity |
| Die head lip / land | 12 to 18 months | Medium | Parison defect, wall variation |
| Hydraulic seals | 12 to 18 months | Low to Medium | Oil loss, clamping force drift |
| Heating bands / cartridge heaters | 2 to 3 years | Low | Zone temperature drift, degradation |
| Cutting knife / parison cutter | 6 to 12 months | Low | Ragged parison, flash increase |
| Blow mold (cavity life) | 3 to 5 million shots | Medium | Surface defect, dimensional drift |
The screw and barrel are the heaviest maintenance expense, landing near the end of the five-year window for a well-run line but potentially earlier under abrasive regrind or contaminated material. A worn barrel increases the energy needed to plasticize the melt and degrades homogenization, which quietly lifts both the energy and the scrap domains. Die head lip and hydraulic seals sit on a 12 to 18 month cycle, so a five-year plan should budget for roughly three to four replacements of each. Heating bands typically last two to three years, and the parison cutter can need attention every six to twelve months depending on cut quality. The blow mold, rated for 3 to 5 million shots, usually survives the full horizon for a line producing under roughly 1.5 million containers per year, but a high-volume three-shift operation may approach its limit by year five and should reserve a mold refurbishment index.
The Wanplas brand’s shared after-sales policy, which Apollo extends to its blow molding customers, includes an annual complimentary spare-parts allowance and free replacement of parts within the warranty window. From a TCO perspective the value is not the nominal allowance but the assurance of genuine-specification seals, heating bands, and cutter blades that fit on the first attempt, avoiding the scrap and downtime penalty of poorly matched third-party parts.
Scrap, Flash Recovery, and Downtime Loss
The scrap and downtime domain is the most volatile of the five, because it is tied directly to process stability rather than to a fixed schedule. It has two sub-streams: material scrap from defective parts, and production loss from unplanned stoppage. Both are expressed here as indexed shares and as percentages of through-put rather than as currency.
Material utilization is governed by the flash ratio, the proportion of extruded melt that becomes non-product flash at the parting line and neck rather than finished container wall. For a 20L jerry can, the flash recovery ratio typically falls between 15% and 30% of total extruded mass, depending on mold design and parison programming. The key point is that flash is not lost: a crusher or granulator returns it to the feed stream as regrind, so the effective material loss is only the portion that is contaminated, oxidized, or rejected for quality. A line that recovers and reuses flash at the upper end of the range keeps the material sub-domain near the Low level, while a line that discards flash pushes it toward High.
The reject or scrap rate, measuring containers that fail leak, dimension, or appearance checks, normally sits between 1.5% and 4% of production for a stabilized 20L line. At 1.5% the scrap sub-domain is a small index contributor; at 4% it becomes material, energy, and labor spent on parts that must be reground or discarded, and it also signals process instability that usually coexists with higher downtime. Downtime loss compounds this: every hour of stoppage at 90 pieces per hour represents roughly 90 containers of lost output, and at typical OEE of 78% to 88% there is already a 12% to 22% implicit loss baked into the plan before any breakdown.
| Factor | Typical Range | Scrap & Downtime Index | Lever to Improve |
|---|---|---|---|
| Flash recovery ratio | 15% to 30% | Low (if reused) | In-line crusher, regrind dosing |
| Reject / scrap rate | 1.5% to 4% | Low to Medium | Parison programming, mold cooling |
| OEE | 78% to 88% | Medium | PM plan, quick-change tooling |
| Unplanned downtime events | 2 to 8 per year | Medium to High | Spare parts stock, training |
Two design choices suppress this domain. First, an in-line crusher that feeds regrind directly back to the hopper with a controlled dosing ratio (commonly up to 20% to 30% regrind content for HDPE jerry cans) converts what would be waste into saleable wall. Second, a leak tester integrated into the take-away conveyor catches failures before palletizing, preventing a batch recall that would dwarf the normal scrap index. For UN 1H1 hazardous-goods containers, the leak test is not optional, so its cost belongs in CAPEX auxiliaries and its benefit is counted here as scrap-domain suppression.
Five-Year Depreciation and the Indexed Cost Evolution Model
Depreciation converts the one-time CAPEX into a smoothed annual charge and reveals how the cost personality of the machine changes with age. The reference model uses straight-line depreciation over five years with a residual value rate that reflects the secondary-market demand for a well-maintained 20L EBM machine. A residual rate in the band of 10% to 20% of original CAPEX is realistic for machines with documented maintenance history and genuine spare-part provenance.
Under straight-line depreciation, year one carries the full CAPEX weight in book terms, but in cash terms CAPEX is already spent at year zero. The more useful view for a buyer is the annual cash TCO, which starts CAPEX-heavy in year one (because the machine and mold are paid, installation is fresh, and early scrap rates are higher during ramp-up) and becomes progressively operating-dominated by year five as depreciation completes and wear-part replacement clusters. The indexed evolution below shows the share of each domain across the five years, normalized so that each year’s total is 100 index points for that year.
Annual run hours also shift the picture. The reference assumes 6,000 hours per year, but many chemical-packaging operations run 7,200 hours across extended shifts, which raises the energy, labor, and maintenance accrual rates proportionally while the CAPEX index stays fixed. Because CAPEX is spread over more units, the per-unit TCO index falls as run hours rise, which is why high-utilization buyers consistently report a lower effective cost than low-utilization buyers on the identical machine.
A 20L EBM machine that runs 7,200 hours per year amortizes its fixed CAPEX over 20% more output than one running 6,000 hours, lowering the per-unit indexed cost even before any efficiency upgrade is considered.
Year-by-Year TCO Breakdown
The table below presents the five-year ownership cost as an indexed evolution. Each column is the cost incurred in that year, expressed as index points against the 100-point five-year baseline, and the bottom row shows the cumulative share reaching 100 by year five. This is the structural decomposition the title promises: it shows not just the total but how the mix migrates from capital to operations.
| Cost Domain | Year 1 | Year 2 | Year 3 | Year 4 | Year 5 | 5-Year Total |
|---|---|---|---|---|---|---|
| CAPEX (depreciated charge) | 7.0 | 5.2 | 5.2 | 4.3 | 4.3 | 26.0 |
| Energy | 6.2 | 6.2 | 6.2 | 6.2 | 6.2 | 31.0 |
| Labor | 3.6 | 3.6 | 3.6 | 3.6 | 3.6 | 18.0 |
| Maintenance & spare parts | 1.8 | 2.1 | 2.4 | 2.7 | 3.0 | 12.0 |
| Scrap & downtime | 3.4 | 2.7 | 2.4 | 2.3 | 2.2 | 13.0 |
| Annual total | 22.0 | 19.8 | 19.8 | 19.1 | 19.3 | 100.0 |
| Cumulative % of 5-yr | 22% | 42% | 62% | 81% | 100% | 100% |
The evolution tells a clear story. Year one is the most expensive at 22 index points, inflated by the full CAPEX charge, ramp-up scrap, and commissioning. By year five the annual cost has fallen to roughly 19 index points, and the composition has flipped: energy and labor now dominate while CAPEX has shrunk to its residual charge and scrap has improved as the process matures. The maintenance domain, by contrast, rises every year, climbing from 1.8 to 3.0 as wear components reach replacement thresholds. A buyer who fixes only the year-one number misses this trajectory entirely and may over-pay for a machine whose later-year maintenance index is structurally high.
Two sensitivity cases reshape the table. If the buyer selects all-electric, the energy column falls by a 0.60 to 0.75 multiple, shaving roughly 8 to 12 index points from the five-year total and pulling the energy domain below labor. If the buyer neglects preventive maintenance, the scrap and downtime column can rise by a multiple of 1.5 to 2.0 in years three through five, erasing the depreciation savings and pushing the five-year total above 110 index points. The indexed model makes both outcomes visible without a single currency conversion.
Material Specification Impact: HDPE Blow Molding Grade
The polymer is not a cost domain by itself, but it loads three of the five domains simultaneously: material appears inside scrap, energy is spent plasticizing it, and its processability determines reject rate. For 20L jerry cans and chemical pails, high-density polyethylene in a blow molding grade is the default resin, and its specification directly affects TCO.
| HDPE Blow Molding Property | Typical Range | TCO Relevance |
|---|---|---|
| Melt flow rate (MFR) | 0.3 to 0.8 g/10min (190°C / 2.16 kg) | Low MFR raises torque, energy; high MFR eases processing |
| Density | 0.950 to 0.958 g/cm³ | Higher density raises part weight and material index |
| Environmental stress crack resistance (ESCR) | Grade dependent, High for chemical packs | Low ESCR raises field-failure and recall risk |
| UN packaging certification | UN 1H1 for hazardous goods | Mandatory for chemical drum segment; affects scrap domain |
Melt flow rate, measured as MFR at 190°C under a 2.16 kg load, is the primary processability indicator. A blow molding grade in the 0.3 to 0.8 g/10min window balances melt strength, needed to hold the parison without sag, against the torque the screw and barrel must develop. Too low an MFR forces the extruder to work harder, lifting the energy index; too high an MFR can cause parison instability and thin spots, lifting the scrap index. Density in the 0.950 to 0.958 g/cm³ band determines the part weight for a given wall thickness, so a resin at the top of the range adds grams per container and therefore material and energy cost across millions of pieces.
Environmental stress crack resistance, commonly abbreviated as ESCR, is a silent TCO factor for chemical packaging. A container that passes the leak test on the line but fails in the field under sustained chemical contact generates a recall cost that dwarfs every indexed domain in this article. Specifying an HDPE grade with verified ESCR and validating it against the actual fill chemistry is therefore a cost-avoidance measure, not a luxury. For hazardous goods the UN 1H1 certification defines the design-type test the container must pass, and the mold, neck insert, and wall distribution must be engineered to meet it consistently, which is why mold quality re-enters the TCO discussion here.
Material strategy also interacts with flash recovery. Because regrind from an HDPE jerry can line is compositionally identical to virgin polymer, it can be re-dosed at a controlled ratio that preserves MFR and ESCR within specification. A disciplined regrind loop keeps the material sub-domain at the Low level and reduces the virgin resin index, while a careless loop that allows contamination or over-heating degrades MFR and forces either higher scrap or a virgin-only run. The polymer, in short, is where the scrap, energy, and material domains meet.
Certification, Compliance, and Hidden Cost Avoidance
Certification is frequently treated as a paperwork line item, but in the TCO framework it is a hidden-cost avoidance mechanism. A machine and a finished container that meet the relevant standards avoid border rejection, customer audit failure, and product-liability exposure, each of which can impose a Very High or Premium cost event that no depreciation schedule captures.
| Standard | Scope | TCO Protection |
|---|---|---|
| CE certification | EU machinery directive compliance | Enables EU market access, avoids rework |
| ISO 9001 | Quality management system | Lowers process-variation and scrap index |
| EN 422 | Blow molding machine safety | Defines guarding, reduces incident cost |
| IEC 60204-1 | Electrical safety of machinery | Protects against electrical fault downtime |
| UN 1H1 | Hazardous goods packaging design | Mandatory for chemical drum qualification |
CE certification and EN 422 together define the safety and market-access baseline for European buyers, while IEC 60204-1 governs the electrical architecture regardless of region. ISO 9001 is less about a single document and more about the disciplined process control that keeps the scrap domain at the Low to Medium level across the five years. UN 1H1 is specific to the hazardous-goods container segment and is non-negotiable for chemical pail production; a mold that cannot hold the UN 1H1 wall-distribution and drop-test requirements forces either a mold rebuild or a market exit, both of which are Premium-cost events.
Apollo, as a Wanplas factory, builds its extrusion blow molding machines to CE and ISO 9001 expectations and engineers its chemical-packaging molds toward UN 1H1 compatibility, which converts what could be a hidden cost into a planned, indexed assumption. The practical buyer takeaway is to verify that the quoted machine and mold carry the certifications relevant to the destination market before signing, because retrofitting compliance after delivery carries a Very High cost multiplier compared with building it in.
Regional Buyer Scenarios
The five cost domains weigh differently by region because energy tariffs, labor rates, import tariffs, and ambient conditions vary. The indexed model accommodates this without currency: the same 100-point baseline is rescaled by region-specific weights. The table below shows representative relative levels for four common buyer regions, holding the machine specification constant.
| Region | Energy Level | Labor Level | Logistics / Tariff | Dominant Lever |
|---|---|---|---|---|
| North America | High | High | Medium | All-electric drive, automation |
| Western Europe | Very High | Very High | Medium | Energy + labor saving architecture |
| Middle East & Africa | High (hot ambient) | Low to Medium | Medium to High | Chiller capacity, OEE |
| Southeast Asia | Medium | Low | Low to Medium | Volume utilization, regrind |
North American and Western European buyers face High to Very High energy and labor levels, which makes the all-electric or servo-hydraulic drive and higher automation the dominant TCO lever: the Premium CAPEX is recovered fastest where recurring costs are steepest. Middle East and Africa buyers contend with hot ambient conditions that raise the effective specific energy consumption unless the chiller is oversized, so the chiller and OEE become the priority rather than the drive alone. Southeast Asian buyers typically see Low labor and Medium energy, so the winning strategy is volume utilization and an aggressive regrind loop that pushes the material and scrap domains down while the machine runs long hours to amortize CAPEX.
For every region, the Wanplas network’s shared capability matters: the group’s Kerke factory supplies twin-screw extruders for compounding and pelletizing of recycled HDPE that can feed back into blow molding lines, and its Polyretec factory supplies washing and pelletizing systems that turn post-industrial scrap into reusable pellet. Although the 20L EBM machine itself is Apollo’s domain, a buyer planning a closed-loop material strategy can coordinate across Wanplas factories to reduce the virgin-resin portion of the scrap domain, a structural cost advantage that a single-machine supplier cannot offer.
Frequently Asked Questions
What is total cost of ownership for a 20L extrusion blow molding machine?
Total cost of ownership is the full five-year financial commitment of owning the machine, covering the five domains of CAPEX, energy, labor, maintenance and spare parts, and scrap plus downtime loss. In this article the sum is normalized to a 100-point indexed baseline so that buyers can compare proposals from different suppliers and regions without converting currency, with CAPEX at 26 points, energy at 31, labor at 18, maintenance at 12, and scrap and downtime at 13.
Why does energy dominate the five-year cost more than the machine price?
A 20L EBM machine runs a 90 kW to 160 kW extruder and a hydraulic clamp for 6,000 to 7,200 hours per year, so the cumulative electricity index reaches 31 points against a 100-point baseline, exceeding the machine frame share. Specific energy consumption of 0.35 to 0.55 kWh per kilogram means the recurring energy draw far outweighs the one-time CAPEX once realistic production volume is applied, which is why drive architecture is the strongest single TCO lever.
How much can an all-electric drive reduce the energy domain?
Compared with a variable-pump hydraulic baseline, an all-electric drive reduces energy consumption by a multiple of roughly 0.60 to 0.75, equivalent to a 25% to 40% saving in the energy domain. That saving shifts the energy index from around 31 points toward 24 to 27 points and, over five years, can lower the total baseline below 95 points, at the cost of a Premium CAPEX level and a practical clamping-force ceiling.
What is the difference between an accumulator head and continuous extrusion?
Continuous extrusion feeds a steady parison into an open mold and suits stable, repeatable production in the lower part of the size band. An accumulator head stores a measured melt shot and releases it rapidly to form a large parison in one motion, which is essential for thick-wall 20L chemical pails and for minimizing parison sag. The accumulator design lifts both CAPEX and auxiliary energy indices but protects part quality on demanding applications.
How often should screw, barrel, and die head components be replaced?
The screw and barrel typically last 5 to 8 years, die head lip and land 12 to 18 months, hydraulic seals 12 to 18 months, heating bands 2 to 3 years, and the parison cutter 6 to 12 months, while the blow mold is rated for 3 to 5 million shots. A five-year maintenance plan should therefore budget for three to four replacements of seals and die lips and one possible screw-and-barrel intervention near the end of the horizon.
What specific energy consumption should a buyer expect for HDPE jerry cans?
For 20L HDPE jerry cans the specific energy consumption ranges from 0.35 to 0.55 kWh per kilogram of finished container. The lower figure is achieved by all-electric or well-tuned servo-hydraulic machines at high OEE, while the upper figure is typical of older fixed-speed hydraulic designs. Every 0.05 kWh/kg reduction compounds across the full through-put and is the difference between a Medium and a Very High energy level.
How does flash recovery affect the scrap and material domains?
Flash at the parting line and neck normally represents 15% to 30% of total extruded mass, but an in-line crusher returns it as regrind that can be re-dosed at a controlled ratio, often up to 20% to 30% of the feed for HDPE jerry cans. A disciplined regrind loop keeps the material sub-domain at the Low level, while discarding flash pushes it toward High and inflates both material and energy indices with no functional benefit.
What HDPE grade properties matter most for 20L chemical pails?
The key properties are melt flow rate in the 0.3 to 0.8 g/10min window at 190°C under 2.16 kg load, density in the 0.950 to 0.958 g/cm³ band, environmental stress crack resistance suited to the fill chemistry, and UN 1H1 compatibility for hazardous goods. Too low an MFR raises torque and energy, while weak ESCR invites field failure and recall, a Premium-cost event that no depreciation schedule captures.
How does running more shifts change the indexed cost breakdown?
Moving from a single shift to three shifts multiplies the labor index by roughly a factor of three but spreads the fixed CAPEX and the standby portion of energy across far more units, lowering the per-unit TCO index. At 7,200 annual run hours versus 6,000, the fixed CAPEX is amortized over 20% more output, so high-utilization buyers consistently report a lower effective indexed cost than low-utilization buyers on the identical machine.
Which certifications protect the total cost of ownership most directly?
CE certification and EN 422 govern European market access and blow molding machine safety, IEC 60204-1 covers electrical safety, ISO 9001 drives the process discipline that suppresses scrap, and UN 1H1 qualifies hazardous-goods containers. These standards convert potential Very High or Premium hidden-cost events, such as border rejection or recall, into planned indexed assumptions that the buyer can manage from day one.
Does a higher OEE really lower the five-year cost?
Yes. OEE in the 78% to 88% band means 12% to 22% of planned time is already lost before any breakdown, and every lost hour still draws conditioning load while producing nothing, raising effective specific energy consumption. Lifting OEE through preventive maintenance and quick-change tooling lowers the energy and scrap indices simultaneously and delays the wear-part replacements that cluster in years three through five.
Is a double-station or single-station 20L machine better for TCO?
A double-station configuration carries a higher CAPEX level but produces two containers per cycle window, raising output toward the 120 pcs/h end and lowering unit energy and labor indices. For buyers with steady high volume, double station improves the blended TCO even at higher upfront cost; for buyers with low or intermittent volume, single station keeps CAPEX at a Medium level and avoids paying for unused capacity.
Conclusion
The total cost of ownership of a 20L extrusion blow molding machine is not the number on the pro forma invoice. It is a five-domain structure that begins capital-heavy in year one, with CAPEX at 26 index points of a 100-point baseline, and matures into an operating-dominated profile by year five, where energy at 31 points and labor at 18 points govern the recurring burden. The maintenance domain rises every year as wear components reach replacement, while the scrap and downtime domain should fall as the process stabilizes, provided flash recovery and leak testing are engineered in from the start.
For global buyers, the actionable lessons are consistent regardless of region. Specify the drive architecture to match the energy and labor levels of the destination market, treat the blow mold and auxiliaries as first-class CAPEX line items rather than afterthoughts, select HDPE blow molding grade resin by MFR, density, ESCR, and UN 1H1 fit rather than by price alone, and verify CE, ISO 9001, EN 422, IEC 60204-1, and UN 1H1 compliance before signing. Apollo, a Wanplas factory with more than 20 years in extrusion blow molding and a product range from 200mL daily-chemical bottles to 20L chemical pails and beyond, positions its ABLB and ABLD series and its fully electric line to let buyers trade CAPEX against operating cost on a like-for-like basis. When every proposal is expressed against the same 100-point indexed baseline, the five-year decision becomes a structural comparison rather than a guessing game, and the machine that wins is the one whose cost mix best fits the buyer’s volume, region, and resin strategy.