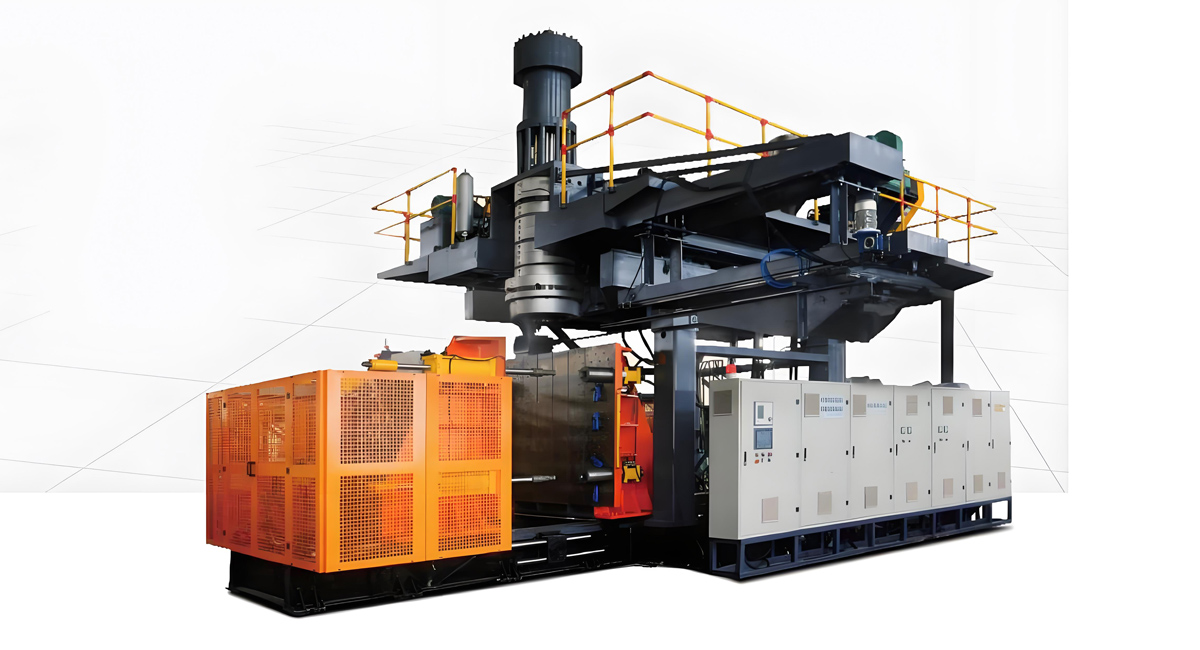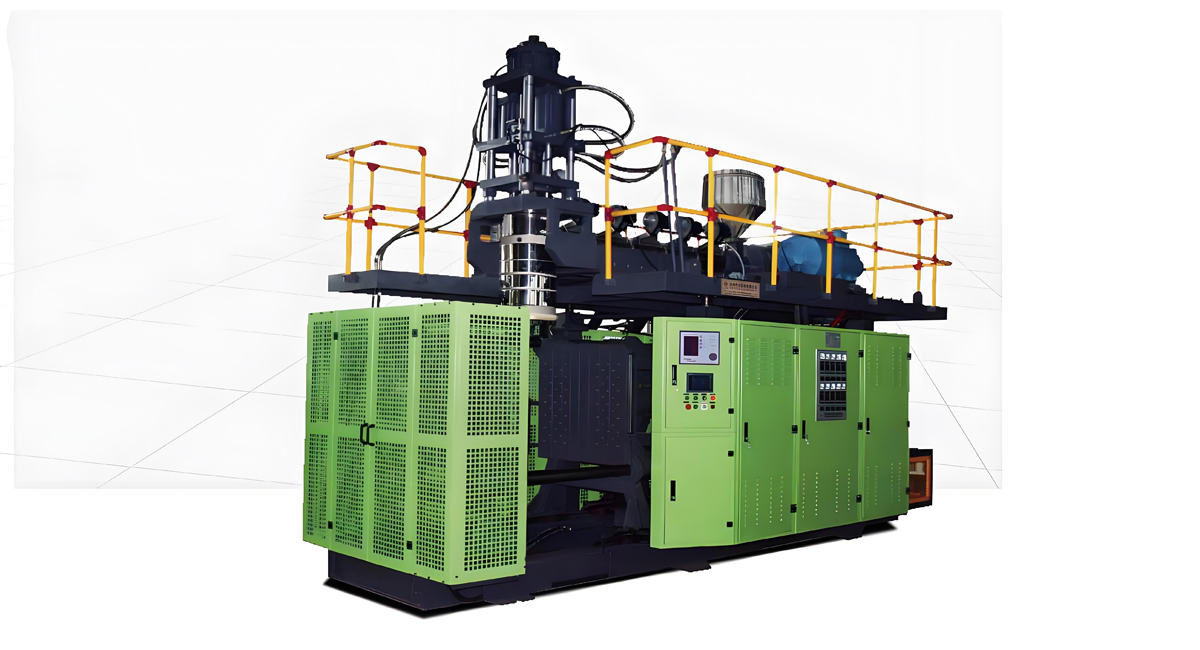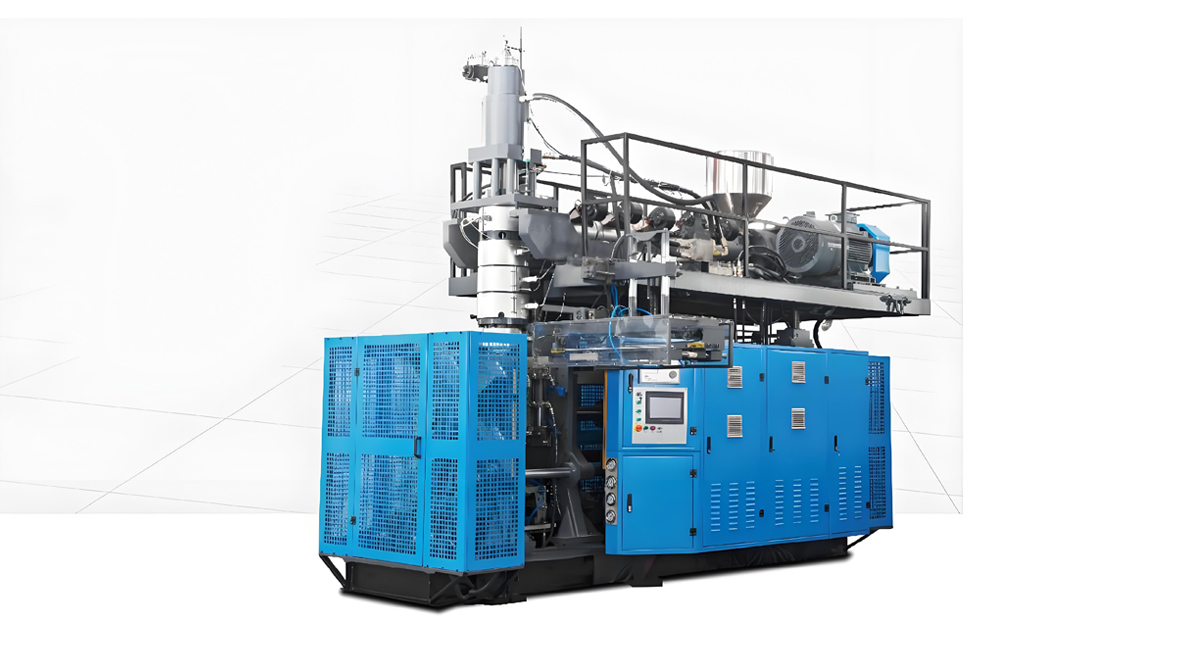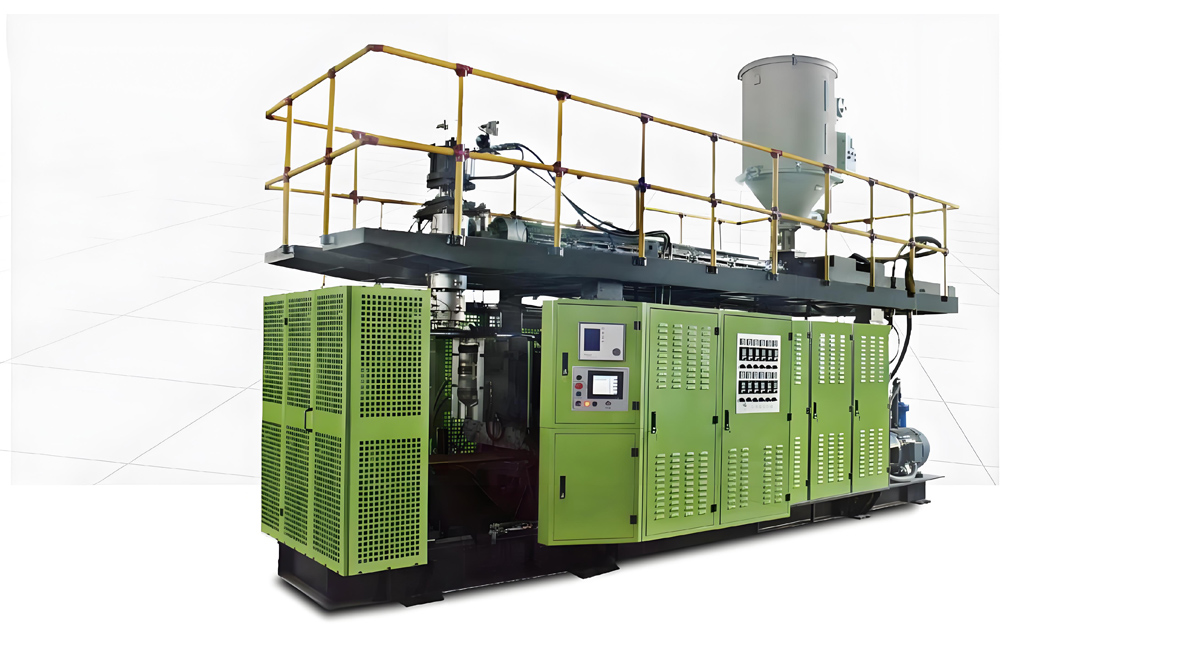

Electricity is the single largest recurring input in an extrusion blow molding plant that has already optimised its resin purchasing, and unlike resin it is almost entirely under engineering control. A blow molding line that converts one kilogram of HDPE into finished bottles using 0.85 kWh and a line that does the same job using 0.42 kWh are producing identical parts from identical raw material — the difference lives entirely in the drive architecture, the thermal envelope, the compressed air circuit and the way the machine behaves during the seconds when it is not actually moving anything. This article sets out the physics behind those differences, then builds a repeatable arithmetic method that lets a plant engineer calculate the annual kilowatt-hour reduction achievable by moving from hydraulic to fully electric extrusion blow molding, using nothing more than annual throughput in kilograms and a measured specific energy consumption figure.
Throughout this guide every saving is expressed in kilowatt-hours, percentages, index points or relative bands. Tariff structures differ enormously between regions, contract types, time-of-use windows and demand-charge regimes, so any attempt to state a universal monetary saving would be misleading. Convert the kilowatt-hour figures to money yourself using the tariff structure on your own supply contract — the engineering work is in getting the kilowatt-hours right, and that is what follows. Apollo, a Wanplas factory in Zhangjiagang with more than twenty years of extrusion blow molding machine manufacturing behind it and over 4,000 machines running in more than 90 countries, has built its Fully Electric Series specifically around the loss mechanisms described below, and the numbers used here reflect what the servo-electric architecture can realistically deliver in 2026 rather than a marketing best case.
Why Drive Architecture Is the Largest Controllable Energy Variable in EBM
In extrusion blow molding, the machine spends most of each cycle doing nothing mechanically demanding. The extruder turns continuously and produces the parison, but the clamping unit, the carriage that shuttles the mold, the blow pin actuation and the deflashing motion are all short, high-force events separated by comparatively long idle intervals. A typical 2 L HDPE bottle cycle on a double-station machine might last 14 to 22 seconds, of which the clamping and mold-transfer actions occupy perhaps 2 to 4 seconds in total. Everything else is extrusion, cooling and part removal.
This duty profile is the reason drive architecture dominates the energy picture. A fixed-displacement hydraulic pump must keep turning at full speed for the entire cycle, whether or not any actuator is calling for flow. When no flow is demanded, the oil is simply dumped across a relief valve and the energy is converted into heat that then has to be removed by an oil cooler — a second energy penalty layered on top of the first. A servo-hydraulic system reduces this by varying pump speed with demand, but still maintains a minimum standby flow and still suffers throttling and leakage losses across valves and seals. A fully electric machine draws essentially nothing from the clamping and carriage drives when they are stationary, because a servo motor at zero commanded torque and zero speed consumes only its own control electronics and holding current.
The second reason drive architecture matters is thermal. Hydraulic oil that has been throttled across a relief valve becomes heat, and that heat is dumped into the cooling water circuit. The chiller or cooling tower that removes it consumes electricity in its own right. A 30 kW pump motor spending 60 percent of each cycle in bypass is injecting roughly 18 kW of thermal load into the oil, which at a typical chiller coefficient of performance of 2.8 to 3.5 costs a further 5 to 6.5 kW of compressor power to reject. This cascading penalty is routinely omitted from single-point machine measurements and is a common reason why measured plant-level savings from electrification exceed the savings predicted from machine nameplate comparisons alone.
The third reason is control quality, which affects energy indirectly but materially. Servo-electric axes hold position and velocity profiles far more repeatably than proportional hydraulic valves, particularly across the temperature swings of a long production run. Better repeatability means tighter parison wall thickness control, which means less material per part, which means fewer kilograms extruded and heated per thousand containers. Energy per kilogram and kilograms per part are separate levers, and fully electric architecture improves both simultaneously.
How the Three EBM Drive Architectures Actually Consume Energy
Three drive architectures dominate the extrusion blow molding installed base in 2026: fixed-displacement hydraulic, variable-displacement or servo hydraulic, and fully electric. Understanding their loss mechanisms individually is the prerequisite to any credible energy calculation, because each architecture fails in a different place.
Fixed-Displacement Hydraulic: Constant Flow, Constant Loss
The classic EBM hydraulic circuit uses one or more fixed-displacement vane or gear pumps driven by a constant-speed induction motor, typically a four-pole machine running near 1,450 rpm. The pump delivers a fixed volume of oil per revolution regardless of demand. System pressure is set by a relief valve, and excess flow returns to tank across that valve.
Energy behaviour follows directly from that description. During clamping — the few seconds when the mold closes and pinch-off pressure is developed — the pump is doing genuine useful work and the motor draws close to its rated power. During the remaining 70 to 85 percent of the cycle the pump is still turning, still consuming shaft power to push oil across the relief valve, and still converting that shaft power into oil temperature rise. Measured idle power on such a circuit commonly sits at 25 to 40 percent of the pump motor’s rated power, and older machines with worn pumps, degraded seals and drifting relief settings can exceed 45 percent.
Standby losses are worse than idle losses. Many plants leave hydraulic power units running through mold changes, colour changes, planned short stops and shift handovers because restarting and re-warming the oil takes time. A machine that is genuinely producing for 6,200 hours a year may have its hydraulic power unit energised for 7,000 hours. Those 800 non-productive hours consume real kilowatt-hours and produce zero kilograms, which inflates the specific energy consumption figure without appearing anywhere in the process log.
Variable-Displacement and Servo Hydraulic: Better, but Still Fluid
A servo-hydraulic system pairs a permanent-magnet servo motor with a fixed or variable-displacement pump and controls flow by varying motor speed rather than by throttling. When no actuator demands flow, the motor slows to a low standby speed or stops entirely. Idle power typically falls to 5 to 12 percent of rated pump motor power, a substantial improvement over the fixed-displacement baseline.
Residual losses remain in four places. Volumetric leakage across pump internals and valve spools continues whenever the circuit is pressurised. Pressure drop across directional and proportional valves converts a portion of every actuation into heat even when the motion is useful. Oil viscosity changes with temperature, so the circuit is only at its efficiency optimum within a fairly narrow band, typically 40 to 55 °C for a mineral hydraulic oil of ISO VG 46 grade. And accumulators, where fitted, introduce their own charge-discharge inefficiency.
Accumulator losses deserve specific attention because they are frequently overlooked. Accumulator-assisted EBM machines — common on large ABLD-class equipment handling 20 L to 1500 L containers where a large shot must be delivered quickly — store hydraulic energy in a gas-charged bladder or piston vessel and release it during the high-demand phase. The round-trip efficiency of that store is typically 85 to 92 percent under favourable conditions, but falls when the pre-charge pressure drifts, when gas permeates through the bladder over months of service, or when the discharge is throttled to control velocity. A 10 percent round-trip loss on an accumulator that handles a substantial fraction of the machine’s peak energy demand is not trivial, and the loss is invisible without dedicated instrumentation.
Fully Electric: Torque Only When Torque Is Needed
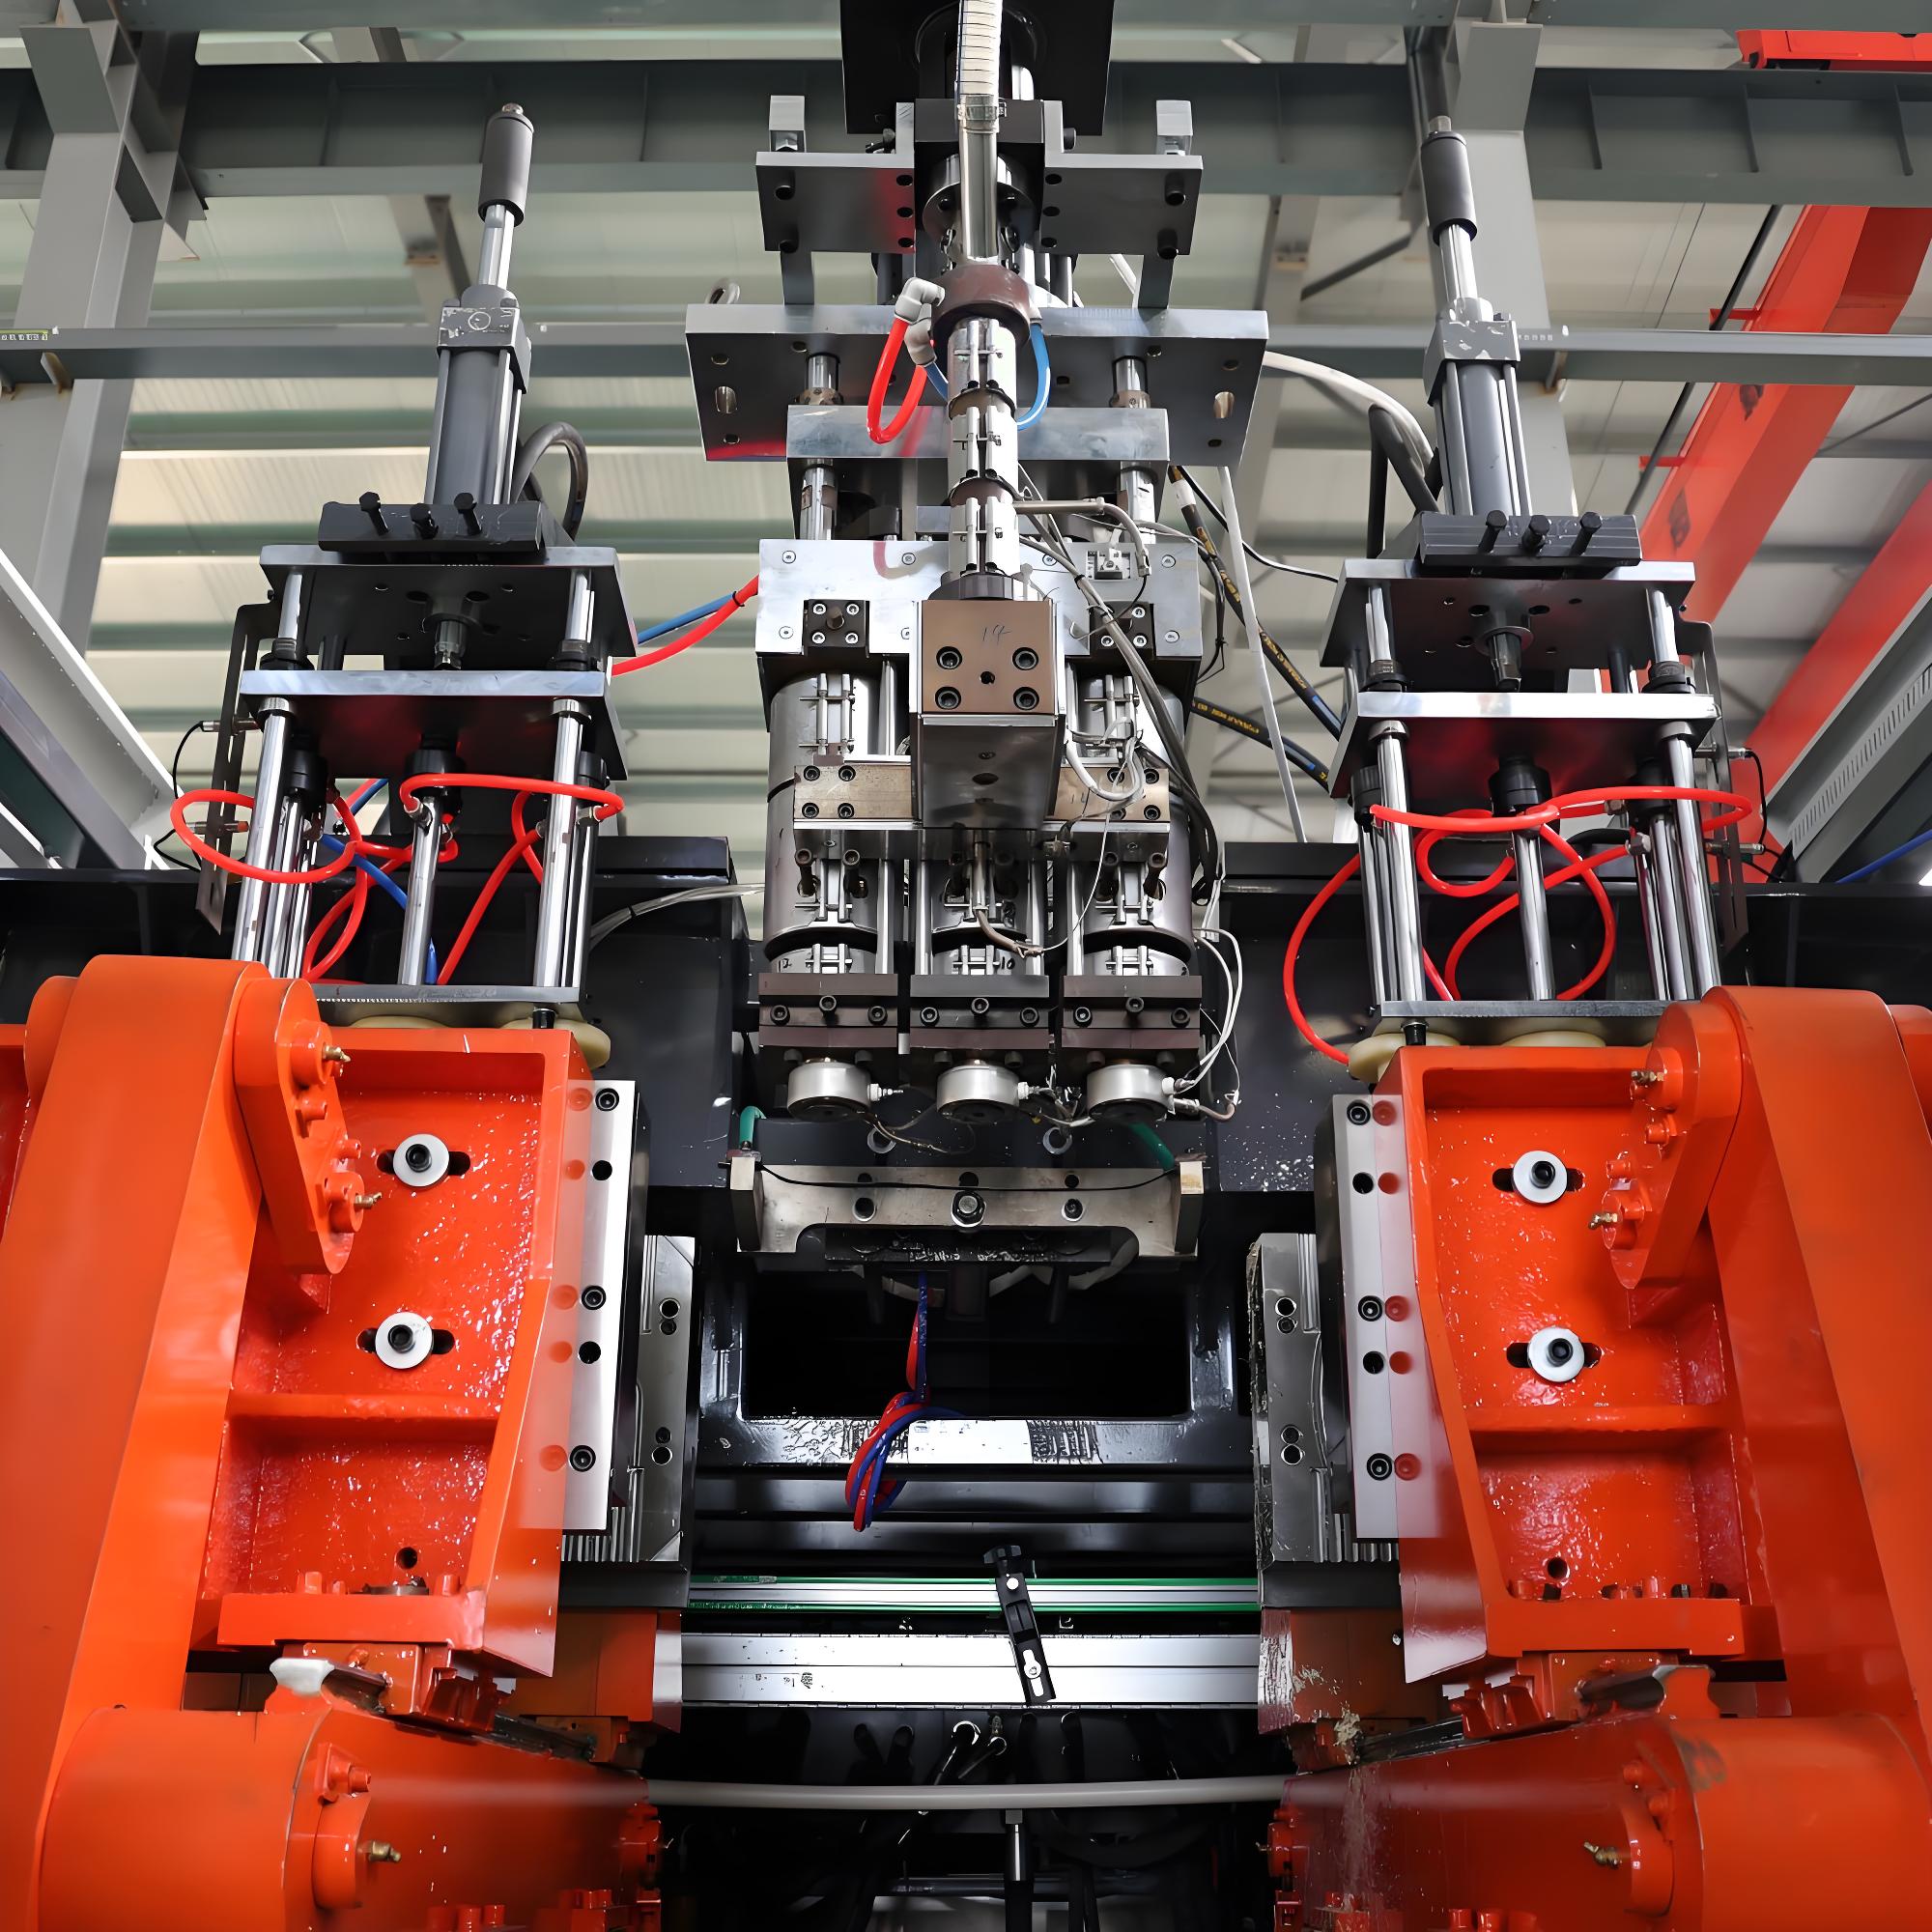
A fully electric extrusion blow molding machine replaces the hydraulic circuit entirely. The clamping unit is driven by a servo motor acting through a toggle mechanism or a ball-screw and crosshead arrangement. The extruder screw is driven by a servo or high-efficiency AC motor through a direct or low-ratio gearbox rather than by a hydraulic motor. Carriage traverse, blow pin insertion, deflashing and part transfer are handled by additional servo axes or by compact electric actuators.
The defining energy characteristic is that a stationary servo axis draws only holding current plus drive electronics losses. On a machine where the clamping unit is mechanically locked in the closed position by toggle geometry, even holding current approaches zero because the toggle carries the pinch-off force mechanically rather than the motor carrying it electrically. Measured standby draw on the motion side of a fully electric EBM machine is commonly under 2 percent of connected motion power, against 25 to 40 percent for the fixed-displacement equivalent.
A second, less discussed benefit is regenerative braking. When a servo-driven clamping unit decelerates a moving mass at the end of a stroke, the motor acts as a generator. On drive systems with a common DC bus, that recovered energy is available to other axes on the same bus rather than being dissipated in a braking resistor. On a machine with several coordinated axes and a well-designed bus, 3 to 8 percent of motion energy can be recirculated internally. This is a modest number in isolation but it compounds over millions of cycles per year.
What fully electric architecture does not change is the heating load. The barrel heaters, die head heaters and neck-ring or blow-pin heaters draw resistive power regardless of drive type. Nor does it change compressed air demand, cooling water demand or auxiliary equipment demand. Understanding this boundary is essential to setting realistic expectations, and it is why the percentage breakdown in the next section matters more than any headline claim.
Table 1: Drive Architecture Energy Characteristics Compared
| Characteristic | Fixed-Displacement Hydraulic | Variable / Servo Hydraulic | Fully Electric |
|---|---|---|---|
| Idle power as share of rated motion power | 25–40% (worn units up to 45%) | 5–12% | Under 2% |
| Standby loss during stops and mold changes | High — power unit usually left running | Medium — motor idles or sleeps | Very Low — drives at zero, heaters only |
| Accumulator round-trip loss (where fitted) | 8–15% of stored energy | 8–15%, degrading with pre-charge drift | Not applicable — no hydraulic store |
| Valve throttling and leakage loss | High | Medium | None |
| Waste heat rejected into cooling circuit | High — dedicated oil cooler required | Medium — smaller oil cooler | Low — drive cabinet ventilation only |
| Energy recovery on deceleration | None | Limited | 3–8% of motion energy via DC bus sharing |
| Typical SEC band, PE containers (kWh/kg) | 0.65–0.90 | 0.50–0.70 | 0.35–0.55 |
| Repeatability of clamping and carriage motion | Medium, drifts with oil temperature | Good | Excellent, temperature independent |
| Noise level in the machine bay | High | Medium | Low |
| Cleanroom and pharmaceutical suitability | Low — oil mist and leak risk | Medium | High — no hydraulic fluid present |
| Maintenance burden (fluid, filters, seals) | High | Medium | Low |
| Relative capital outlay band | Low | Medium | High to Premium |
Where the Kilowatt-Hours Go: Energy Breakdown by Percentage
Before any saving can be calculated, the baseline must be decomposed. An extrusion blow molding cell is not a single load; it is a cluster of loads with very different behaviours, and electrification only attacks one of them directly. The percentages below represent the typical distribution measured across mid-size EBM cells producing PE containers, and they should be treated as a starting template to be replaced by your own sub-metered data as soon as that data exists.
Extrusion Heating and Plasticising: 35 to 45 Percent
This is the largest single block and it is largely architecture-independent. It comprises the barrel heater bands, the die head heaters, the adaptor and screen changer heaters, and the mechanical work done by the extruder screw in shearing and conveying the melt. On a well-run single-screw extruder with an L/D ratio of 25 to 30:1 processing HDPE, a significant portion of the enthalpy needed to bring resin from ambient to a melt temperature of 175 to 210 °C actually comes from viscous shear rather than from the heater bands. Once the barrel reaches steady state, heater duty cycles on the middle and front zones often drop below 20 percent, and on high-shear screws the front zones may call for cooling rather than heating.
The theoretical enthalpy required to heat and melt HDPE from 25 °C to 200 °C is roughly 0.19 to 0.22 kWh per kilogram, accounting for specific heat capacity of approximately 2.3 kJ/kg·K in the solid state, the heat of fusion of around 200 to 230 kJ/kg, and the melt-state specific heat. Any measured extrusion energy above about 0.25 kWh/kg therefore represents inefficiency: radiation from bare barrel surfaces, conduction into the frame, oversized heater bands cycling against active cooling, or a screw geometry that is generating far more shear heat than the process needs and then requiring barrel cooling to remove it.
Clamping and Mold Motion: 15 to 25 Percent
This is the block that electrification attacks directly. It includes mold opening and closing, clamping force maintenance during blow and cooling, carriage traverse on shuttle machines, and blow pin or calibration pin actuation. On a fixed-displacement hydraulic machine this block is inflated by the bypass losses described earlier; on a fully electric machine it shrinks dramatically because the energy is only drawn during actual motion. In practice, moving from fixed-displacement hydraulic to fully electric typically reduces this block by 55 to 75 percent.
Hydraulic Power Unit Standby: 10 to 20 Percent
On a fully electric machine this block is essentially zero. On a fixed-displacement hydraulic machine it is one of the largest avoidable losses in the entire plant, and it is invisible to operators because the pump makes the same noise whether it is doing work or not. On servo-hydraulic machines it typically falls to 3 to 7 percent. Because this block disappears entirely with electrification rather than merely shrinking, it is the primary driver of the headline percentage reduction.
Compressed Air for Blowing: 10 to 20 Percent
Blow air, pre-blow air, exhaust and pneumatic actuation together form a block that fully electric drive does not touch. The energy is consumed at the compressor house rather than at the machine, which is why machine-terminal measurements understate the true cell footprint. Section eight deals with this block in detail.
Cooling Water System: 8 to 15 Percent
Mold cooling, oil cooling on hydraulic machines, extruder feed throat cooling and barrel zone cooling all draw on the chilled water and tower water circuits. Chiller compressor power, pump power and cooling tower fan power all belong in this block. Electrification reduces this block indirectly by removing the oil cooling load, typically by 15 to 30 percent of the block.
Auxiliary Equipment: 5 to 10 Percent
Material conveying and vacuum loaders, dehumidifying dryers where hygroscopic materials such as PA, PC or PETG are processed, central feeding, granulators reprocessing flash, take-out conveyors, leak testers and downstream trimming stations. This block is architecture-independent but frequently oversized. Flash granulators in particular are often left running continuously when they only need to run intermittently.
Table 2: Energy Breakdown of an EBM Cell by Drive Architecture
| Energy Block | Typical Share Range | Fixed Hydraulic (index, baseline 100) | Servo Hydraulic (index) | Fully Electric (index) |
|---|---|---|---|---|
| Extrusion heating and plasticising | 35–45% | 40 | 40 | 38 |
| Clamping and mold motion | 15–25% | 20 | 13 | 7 |
| Hydraulic power unit standby and bypass | 10–20% | 15 | 5 | 0 |
| Compressed air for blowing and actuation | 10–20% | 14 | 14 | 14 |
| Cooling water system (mold, oil, barrel) | 8–15% | 11 | 9 | 8 |
| Auxiliary equipment (drying, conveying, granulating) | 5–10% | 7 | 7 | 7 |
| Total cell index | 100% | 107 (baseline set to 100 after normalising) | 88 | 74 |
Normalising the fixed-displacement column to an index of 100 gives a servo-hydraulic index of approximately 82 and a fully electric index of approximately 69, which corresponds to reductions of 18 percent and 31 percent respectively at the whole-cell boundary. Note that these whole-cell figures are more conservative than the machine-only figures often quoted, precisely because they include compressed air and auxiliaries that electrification does not improve. When comparing quotations from suppliers, always confirm which boundary a claimed saving refers to.
Specific Energy Consumption: The Metric That Travels Between Plants
Specific energy consumption, abbreviated SEC and expressed in kilowatt-hours per kilogram of good product, is the only energy metric that survives a change of machine size, product mix, shift pattern or country. Power in kilowatts tells you nothing without duration. Annual kilowatt-hours tell you nothing without output. SEC normalises both and lets a 200 ml shampoo bottle line be compared with a 20 L jerrycan line on a defensible basis.
Defining the Metric Precisely
SEC is calculated as total electrical energy consumed over a defined period, divided by the mass of saleable product produced in that same period. Three definitional decisions must be made explicit and then held constant:
- Measurement boundary. Machine terminal box only, machine plus dedicated auxiliaries, or whole cell including a proportional allocation of compressed air and chilled water. Each is legitimate; mixing them is not.
- Mass basis. Kilograms of resin extruded, or kilograms of saleable finished product after flash removal and quality rejection. The second is the honest basis, because flash that is reground and refed has already consumed melting energy once. On a typical container with a pinch-off and a moil, flash may represent 15 to 40 percent of extruded mass, so the two bases can differ by a factor of well over one.
- Time window. A single stable production hour, a full shift, or a rolling month. Monthly windows capture start-ups, mold changes and idle periods and therefore give the number that actually explains the meter reading.
The convention used throughout this article is: whole-cell boundary excluding compressed air generation, mass basis of saleable finished product, rolling monthly window. This is the most useful convention for annual budgeting because it directly multiplies against sales tonnage.
Benchmark Bands for PE Containers
Across the extrusion blow molding installed base, SEC for HDPE and LDPE containers between 200 ml and 20 L falls into reasonably consistent bands. A fixed-displacement hydraulic machine of an older generation, running at moderate load factor with an uninsulated barrel, will typically measure 0.65 to 0.90 kWh/kg. A well-maintained hydraulic machine with a variable-displacement pump and barrel insulation will measure 0.50 to 0.70 kWh/kg. A modern fully electric machine, correctly sized to its product and running at a healthy load factor, will measure 0.35 to 0.55 kWh/kg.
Material matters as well as machine. PP requires a slightly higher melt temperature than HDPE and has a higher heat of fusion, pushing SEC up by roughly 5 to 10 percent. Rigid PVC processes at lower melt temperature, typically 165 to 185 °C, but requires very careful shear management and often lower screw speeds, which can push SEC in either direction. Engineering resins such as PC and PA add a drying load that can contribute 0.05 to 0.12 kWh/kg on its own, and PC also demands melt temperatures well above 250 °C. Any SEC benchmark must therefore state the material.
The Core Arithmetic
The annual electricity calculation reduces to a single expression:
Annual electricity consumption (kWh) = Specific energy consumption (kWh/kg) × Annual saleable output (kg)
And the saving from an architecture change is:
Annual kWh saved = (SEC baseline − SEC fully electric) × Annual saleable output (kg)
The elegance of this formulation is that it needs no assumption about cycle time, machine count, shift pattern or utilisation. All of those are already embedded in the measured SEC and in the achieved annual tonnage. The engineering work lies in measuring the baseline SEC honestly and in setting a defensible target SEC for the replacement machine — not in the arithmetic itself.
Annual Operating Hours and Load Factor: Building the Duty Model
Although the SEC method does not require an hours model to calculate the saving, an hours model is essential for two other purposes: sizing the electrical infrastructure, and understanding why two plants with identical machines report different SEC values.
Three Standard Shift Patterns
A two-shift operation running five days per week with statutory holidays typically achieves 3,800 to 4,200 scheduled hours per year, of which perhaps 3,300 to 3,700 are productive after mold changes, colour changes and maintenance. A three-shift operation running five or six days per week reaches 6,000 to 7,000 scheduled hours, with 5,300 to 6,300 productive. A genuinely continuous operation running seven days with planned maintenance windows reaches around 8,000 scheduled hours, with 7,200 to 7,600 productive.
The ratio of productive to scheduled hours is where hydraulic and electric architectures diverge sharply. During the 400 to 600 non-productive hours in a three-shift year, a fixed-displacement hydraulic power unit that is left energised continues drawing 25 to 40 percent of its rated power while producing nothing. A fully electric machine in the same state draws only barrel heater standby power, which itself can be reduced by 30 to 50 percent using a standby temperature setback of 40 to 60 °C below process temperature. This is the mechanism by which electrification improves SEC by more than the pure motion-block arithmetic would suggest.
Load Factor and Its Consequences
Load factor is the ratio of average actual power draw to the connected load of the machine. Real EBM cells operate at load factors of 0.55 to 0.85. A machine sized generously for a future large-container product but currently running small containers will sit at the low end; a machine running at its rated extrusion output with a full mold set will sit at the high end.
Load factor affects hydraulic and electric machines asymmetrically. A hydraulic pump at low load factor still turns at full speed, so its bypass loss remains constant in absolute terms while useful output falls — SEC deteriorates rapidly as load factor drops. A servo-electric drive at low load factor simply draws less current, so its SEC degrades only gently. In practice, at a load factor of 0.55 the SEC advantage of fully electric architecture over fixed-displacement hydraulic widens to 45 to 55 percent, while at a load factor of 0.85 it narrows to 25 to 32 percent. Plants with volatile order books and frequent product changes therefore benefit disproportionately from electrification.
Table 3: Operating Hours and Load Factor Model
| Shift Pattern | Scheduled Hours per Year | Productive Hours | Non-Productive Energised Hours | Typical Load Factor | Relative SEC Penalty on Hydraulic |
|---|---|---|---|---|---|
| Two shifts, five days | 3,800–4,200 | 3,300–3,700 | 400–600 | 0.55–0.70 | High (frequent restarts, long idle) |
| Three shifts, five to six days | 6,000–7,000 | 5,300–6,300 | 500–800 | 0.65–0.80 | Medium |
| Continuous, seven days | 7,800–8,200 | 7,200–7,600 | 300–600 | 0.75–0.85 | Low (but absolute kWh largest) |
Worked Calculation: kWh Reduction at 500, 1500 and 3000 Tonnes per Year
The following calculation applies the SEC method to three plant scales that bracket most independent blow molding operations. All figures are kilowatt-hours and percentages. No monetary values are given, because tariff structures vary by region, contract, demand charge and time-of-use window — apply your own tariff structure to these kilowatt-hour figures to obtain a financial result relevant to your supply agreement.
Scenario Definitions
Three baseline-to-target pairs are evaluated at each output tier, representing the realistic spread of outcomes:
- Conservative case: baseline 0.60 kWh/kg (a reasonably maintained servo-hydraulic machine) improving to 0.50 kWh/kg. Improvement 0.10 kWh/kg, or 16.7 percent.
- Typical case: baseline 0.70 kWh/kg (a mixed fleet of hydraulic machines of varying age) improving to 0.45 kWh/kg. Improvement 0.25 kWh/kg, or 35.7 percent.
- Best case: baseline 0.90 kWh/kg (an old fixed-displacement fleet at low load factor with uninsulated barrels) improving to 0.35 kWh/kg. Improvement 0.55 kWh/kg, or 61.1 percent.
Table 4: Annual kWh Reduction at Three Output Tiers
| Annual Output | Case | Baseline SEC (kWh/kg) | Electric SEC (kWh/kg) | Baseline Annual kWh | Electric Annual kWh | Annual kWh Saved | Reduction | Index (baseline = 100) |
|---|---|---|---|---|---|---|---|---|
| 500 t/a (500,000 kg) | Conservative | 0.60 | 0.50 | 300,000 | 250,000 | 50,000 | 16.7% | 83.3 |
| 500 t/a | Typical | 0.70 | 0.45 | 350,000 | 225,000 | 125,000 | 35.7% | 64.3 |
| 500 t/a | Best case | 0.90 | 0.35 | 450,000 | 175,000 | 275,000 | 61.1% | 38.9 |
| 1,500 t/a (1,500,000 kg) | Conservative | 0.60 | 0.50 | 900,000 | 750,000 | 150,000 | 16.7% | 83.3 |
| 1,500 t/a | Typical | 0.70 | 0.45 | 1,050,000 | 675,000 | 375,000 | 35.7% | 64.3 |
| 1,500 t/a | Best case | 0.90 | 0.35 | 1,350,000 | 525,000 | 825,000 | 61.1% | 38.9 |
| 3,000 t/a (3,000,000 kg) | Conservative | 0.60 | 0.50 | 1,800,000 | 1,500,000 | 300,000 | 16.7% | 83.3 |
| 3,000 t/a | Typical | 0.70 | 0.45 | 2,100,000 | 1,350,000 | 750,000 | 35.7% | 64.3 |
| 3,000 t/a | Best case | 0.90 | 0.35 | 2,700,000 | 1,050,000 | 1,650,000 | 61.1% | 38.9 |
Reading the Table Correctly
Three observations follow from this table. First, the percentage reduction is scale-invariant — it depends only on the SEC pair, not on tonnage. A 500-tonne plant and a 3,000-tonne plant achieve the same percentage; only the absolute kilowatt-hours differ. Second, the absolute saving scales linearly with tonnage, which means the payback logic strongly favours high-utilisation plants. Third, the spread between conservative and best case is a factor of 5.5, which is why the baseline measurement is far more important than the target specification. A plant that assumes a 0.70 kWh/kg baseline when the true figure is 0.85 kWh/kg will understate its saving by more than half.
A useful intermediate check is the per-machine figure. A single mid-size EBM machine producing 2 L HDPE containers at a rate of, say, 45 kg per hour and running 6,000 productive hours per year yields roughly 270 tonnes of extruded mass. After deducting flash that leaves the process as sold product at perhaps 78 percent yield, saleable output is around 210 tonnes. In the typical case that machine alone accounts for approximately 52,500 kWh of annual saving. A plant of seven such machines therefore approaches the 1,500 t/a tier in Table 4.
Process Variables That Move Specific Energy Consumption
Buying a fully electric machine sets a new floor, but process settings determine where within the band the plant actually operates. The following variables have the largest measurable influence on SEC and most can be adjusted without capital expenditure.
Melt Temperature and Temperature Profile
For HDPE containers, a melt temperature window of 175 to 210 °C covers almost all commercial work. Running at 205 °C when 185 °C would produce an acceptable parison wastes energy twice: once in the heaters and shear work required to reach the higher temperature, and again in the cooling circuit that must remove the extra enthalpy before the part can be ejected. Every 10 °C of unnecessary melt temperature adds roughly 0.005 to 0.008 kWh/kg on the heating side and extends cooling time by 3 to 6 percent, which reduces output and therefore raises SEC further.
A rising barrel temperature profile — cooler at the feed zone, warmer toward the die head — generally consumes less total energy than a flat profile, because it lets shear work do the melting in the compression zone rather than forcing conduction from the barrel wall. Feed throat cooling should be set only as cold as necessary to prevent bridging, typically 20 to 35 °C for PE; over-cooling the feed throat fights the barrel heaters directly.
Screw Speed, L/D Ratio and Compression Ratio
Screw geometry sets the balance between shear heating and conduction heating. A single-screw extruder with an L/D ratio of 25 to 30:1 and a compression ratio of 2.5 to 3.5:1 is the standard configuration for PE extrusion blow molding, and within that envelope a barrier screw with a mixing section will typically deliver 8 to 15 percent lower SEC than a conventional three-zone screw at the same output, because it achieves melt homogeneity at lower melt temperature.
Screw speed should be set to achieve the required parison drop time at the lowest practicable rpm. Running a screw fast and then throttling with a melt pump or restrictive die converts shaft power into heat that the barrel cooling then removes — a pure loss. Where a melt pump or gear pump is fitted, it should be used to stabilise output pressure, not to compensate for an over-speeded screw.
Barrel Insulation Jackets
Bare barrel surfaces at 190 to 210 °C radiate and convect continuously into the machine bay. Fitting removable insulation jackets over the barrel and die head reduces heater energy by 15 to 25 percent, with the larger figure applying to machines in draughty or air-conditioned halls. The secondary benefits are equally valuable: more stable zone temperatures, faster heat-up from cold, lower ambient temperature around the machine, and reduced burn risk for operators. Implementation difficulty is Low, and this measure applies equally to hydraulic and fully electric machines.
Mold Cooling Water Temperature
Mold cooling water in the 8 to 15 °C band is standard for HDPE containers. Every degree colder shortens cooling time but increases chiller compressor power roughly 2 to 3 percent per degree. The optimum is not the coldest achievable temperature but the highest temperature that still meets the cycle time target without causing post-mold shrinkage or ovality problems. Many plants run chilled water at 7 °C out of habit when 12 °C would deliver the same cycle, sacrificing 10 to 15 percent of chiller energy for nothing.
Flow rate matters as much as temperature. Turbulent flow in the cooling channels, characterised by a Reynolds number above about 4,000, transfers heat several times more effectively than laminar flow. Scaled or partially blocked channels force the chiller to compensate with lower supply temperature. Annual descaling of mold cooling circuits is a Low-difficulty, Medium-saving measure that plants routinely postpone.
Blow Air Pressure Staging and Venturi Recovery
Blow air is frequently supplied at a single high pressure of 8 to 10 bar when the process only requires that pressure during the initial inflation. Staging the supply — a short high-pressure pulse to form the container against the mold surface, followed by a lower holding pressure of 4 to 6 bar during cooling — reduces air mass consumed per part by 20 to 35 percent. Where the machine controls allow independent pre-blow and main-blow pressures, this is a settings change rather than a hardware change.
Air recovery goes further. A venturi-based or receiver-based recovery system captures the exhaust from each blow cycle and returns it to an intermediate-pressure receiver that feeds low-pressure pneumatic consumers such as cylinders, conveyors and part ejectors. Recovery rates of 20 to 40 percent of blow air volume are achievable on machines with large container volumes. Because compressed air generation is one of the least efficient energy conversions in any plant — typically only 10 to 15 percent of compressor input energy ends up as useful pneumatic work — every cubic metre not generated is worth several times its apparent value.
Wall Thickness Control and Material per Part
Parison wall thickness control, whether by a hydraulic or servo-electric die gap actuator with a multi-point programmer, directly determines how many grams go into each container. Moving from a 20-point to a 100-point wall thickness programme typically permits a 3 to 8 percent reduction in part weight while maintaining top-load and drop-test performance. Because SEC is expressed per kilogram, lighter parts do not reduce SEC — but they reduce total annual kilograms, and therefore reduce total annual kilowatt-hours proportionally. A 5 percent lightweighting on a 1,500 t/a plant removes 75 tonnes of throughput and, at 0.45 kWh/kg, approximately 33,750 kWh per year, entirely independently of the drive architecture question.
Compressed Air: The Quiet Second Half of the EBM Energy Footprint
Any energy programme that stops at the machine terminal box will capture only part of the available reduction. Compressed air is generated centrally, metered centrally and therefore rarely attributed to the machine that consumes it, which is exactly why it persists as a large and unmanaged load in blow molding plants.
The Conversion Penalty
Producing compressed air at 7 bar gauge requires approximately 6 to 7 kW of shaft power per normal cubic metre per minute of free air delivery on a well-maintained screw compressor, rising toward 8 kW on older reciprocating units or where intake filters are fouled. Of that input, only a modest fraction is recovered as mechanical work at the point of use; the remainder becomes heat at the compressor and pressure drop in the distribution network. This is why a cubic metre of compressed air saved at the machine is worth substantially more than the same energy saved at an electric motor.
Leakage
Compressed air leakage in an unmanaged plastics plant commonly runs at 20 to 35 percent of total generated volume. Blow molding plants are at the worse end of that range because of the number of quick-connect couplings, rotary unions on carriage-mounted blow pins, and pneumatic cylinders subject to constant cycling. A single 3 mm orifice at 7 bar leaks on the order of 0.5 normal cubic metres per minute, which at 6.5 kW per cubic metre per minute represents about 3.2 kW drawn continuously — roughly 25,600 kWh per year at 8,000 hours. Ultrasonic leak detection surveys conducted twice yearly, with a tagged repair programme, are among the highest-return, Low-difficulty measures available.
Pressure Band Management
Every 1 bar reduction in system pressure reduces compressor input power by roughly 6 to 8 percent. Many EBM plants run the whole compressed air header at 8 or 9 bar because one machine needs high-pressure blow air, when a dedicated booster serving that one machine would allow the general header to drop to 6 bar. Splitting the network into a low-pressure header for actuation and conveying and a high-pressure branch for blowing is a Medium-difficulty measure with substantial and permanent returns.
Heat Recovery from the Compressor House
Between 70 and 90 percent of compressor input energy is recoverable as low-grade heat in the cooling air or cooling water stream. In climates with a heating season, or in plants with a hot-water demand for washdown or resin pre-drying, recovering that heat displaces other energy consumption. This does not reduce the electricity meter reading for compressed air, but it reduces total site energy, which is the number that matters for carbon reporting.
Retrofit and Upgrade Measures Ranked by Saving and Difficulty
Not every plant can replace its fleet. The table below ranks the practical measures available to an existing extrusion blow molding operation by typical saving band and implementation difficulty, allowing a staged programme to be built. Difficulty is rated Low, Medium or High based on downtime required, engineering complexity and the need for external contractors. Capital intensity is expressed as a relative band rather than a figure.
Table 5: Energy Measures, Saving Bands and Implementation Difficulty
| Measure | Energy Block Attacked | Typical Saving | Implementation Difficulty | Capital Intensity Band |
|---|---|---|---|---|
| Ultrasonic compressed air leak survey and repair | Compressed air | 10–25% of air energy | Low | Low |
| Barrel and die head insulation jackets | Extrusion heating | 15–25% of heater energy | Low | Low |
| Standby temperature setback during stops | Extrusion heating | 30–50% of standby heater energy | Low | Low |
| Chilled water setpoint optimisation (8→12 °C where cycle allows) | Cooling water | 8–15% of chiller energy | Low | Low |
| Blow air pressure staging (pre-blow / hold split) | Compressed air | 20–35% of blow air volume | Low to Medium | Low |
| Mold cooling channel descaling programme | Cooling water | 5–12% of chiller energy | Low to Medium | Low |
| Sub-metering and shift-level SEC dashboard | All blocks (enabling) | 3–8% behavioural | Medium | Low to Medium |
| Barrier screw with mixing section retrofit | Extrusion / plasticising | 8–15% of extrusion energy | Medium | Medium |
| Compressed air network pressure split (low / high headers) | Compressed air | 6–8% per bar reduced | Medium | Medium |
| Blow air recovery to intermediate receiver | Compressed air | 20–40% of blow air recovered | Medium to High | Medium |
| Servo pump retrofit on existing hydraulic power unit | Hydraulic standby and motion | 15–30% of machine energy | Medium to High | Medium to High |
| Variable-speed drive on chiller and cooling pumps | Cooling water | 15–30% of pump energy | Medium | Medium |
| Multi-point parison wall thickness controller upgrade | Total kilograms processed | 3–8% material and matching energy | Medium to High | Medium to High |
| Full replacement with fully electric EBM machine | Motion, standby, oil cooling | 25–45% of cell energy (up to 60% versus old fixed-displacement) | High | High to Premium |
| Compressor heat recovery to process hot water | Site total energy | 70–90% of compressor heat recoverable | High | Medium to High |
A sensible sequencing rule is to complete every Low-difficulty measure before committing to any High-difficulty one, for two reasons. First, the Low-difficulty measures typically deliver a combined 10 to 18 percent reduction with minimal disruption. Second, and more importantly, they clean up the baseline. Replacing a machine while the compressed air network is leaking 30 percent and the barrels are uninsulated makes it impossible to attribute the resulting improvement correctly, which undermines the case for the next investment.
Converting Kilowatt-Hours into Carbon: Grid Factor Arithmetic
Increasingly, blow molding plants must report Scope 2 emissions to brand-owner customers, and in some jurisdictions to regulators. The conversion from kilowatt-hours to carbon dioxide equivalent is straightforward once a grid emission factor is selected, and the resulting tonnage is often a more persuasive number internally than the energy figure alone.
Selecting a Grid Emission Factor
Grid emission factors for electricity vary widely by country and by year as generation mixes change. A working band of 0.55 to 0.85 kg CO2e per kWh covers most industrial grids with a substantial thermal generation component. Grids with high hydro, nuclear or renewable penetration fall well below this band; grids dominated by coal fall at or slightly above the upper bound. Use the published national or regional factor applicable to your reporting year, and state the source in your disclosure. Where a plant has a renewable energy purchase agreement, a market-based factor may be used alongside the location-based factor, as required by the Greenhouse Gas Protocol.
Table 6 Equivalent: Carbon Reduction by Output Tier
Applying the band to the typical-case savings from Table 4 gives the following annual carbon reductions. All figures are metric tonnes of carbon dioxide equivalent per year.
| Annual Output | Case | Annual kWh Saved | At 0.55 kg CO2e/kWh | At 0.70 kg CO2e/kWh | At 0.85 kg CO2e/kWh |
|---|---|---|---|---|---|
| 500 t/a | Typical | 125,000 | 68.8 t | 87.5 t | 106.3 t |
| 500 t/a | Best case | 275,000 | 151.3 t | 192.5 t | 233.8 t |
| 1,500 t/a | Typical | 375,000 | 206.3 t | 262.5 t | 318.8 t |
| 1,500 t/a | Best case | 825,000 | 453.8 t | 577.5 t | 701.3 t |
| 3,000 t/a | Typical | 750,000 | 412.5 t | 525.0 t | 637.5 t |
| 3,000 t/a | Best case | 1,650,000 | 907.5 t | 1,155.0 t | 1,402.5 t |
Expressed per kilogram of product, the typical case removes 0.25 kWh/kg, which at 0.70 kg CO2e/kWh corresponds to 0.175 kg CO2e per kilogram of container produced. For a brand owner conducting a life-cycle assessment on a packaging format, that is a directly usable figure and one that converters are increasingly asked to supply. Being able to quote a measured SEC and the associated Scope 2 intensity per kilogram is becoming a commercial qualification in food, beverage, personal care and pharmaceutical packaging tenders.
Measurement and Verification: Proving the Saving on Your Own Floor
A calculated saving is a hypothesis. Converting it into a verified result requires a measurement protocol that survives audit, and the protocol needs to be in place before the machine changes, not after.
Instrumentation
The minimum credible setup is a three-phase power quality meter on the incoming supply to each machine, logging active energy in kWh at intervals of one minute or shorter, with a matching production counter logging good parts. Class 1 accuracy is sufficient for energy management; Class 0.5S is preferable where the data will support a supplier performance guarantee. Current transformers must be sized for the actual load, not the cable rating, because a heavily oversized current transformer measuring a lightly loaded machine loses accuracy at the low end of its range.
Additional instrumentation that repays its installation: a flow meter and temperature pair on the mold cooling circuit to quantify heat rejected, a compressed air flow meter on the machine branch, and a resin weigh hopper or loss-in-weight feeder to give true kilograms extruded rather than inferred kilograms.
Baseline Period
A baseline should span at least four continuous weeks of representative production, covering the normal product mix, at least two mold changes, and both weekday and weekend patterns if the plant runs them. Record throughput in kilograms of saleable product, energy in kWh, and the operating conditions that could confound the comparison: ambient temperature, resin grade and melt flow rate, product mix by weight, and any known machine faults.
Normalisation and Adjustment
The comparison period after installation must be normalised for anything that changed independently of the machine. The most common confounders in extrusion blow molding are ambient temperature, which shifts chiller load between summer and winter by 10 to 25 percent, product mix, which changes the kilograms-per-cycle relationship, and resin grade changes, since a higher melt flow rate resin requires less shear work. The standard approach is a regression of energy against production and degree-days over the baseline period, then applying that regression to predict what the baseline machine would have consumed under the reporting period conditions.
Reporting Cadence
SEC should be reported at shift level to operators, weekly to production management and monthly to the board. Shift-level visibility is where behavioural savings of 3 to 8 percent come from: when an operator can see that leaving the granulator running through a mold change adds measurable kilowatt-hours to their shift, the behaviour changes without any policy being written. Plants that install metering but only review it quarterly capture a fraction of the available behavioural benefit.
Apollo Fully Electric EBM in Practice
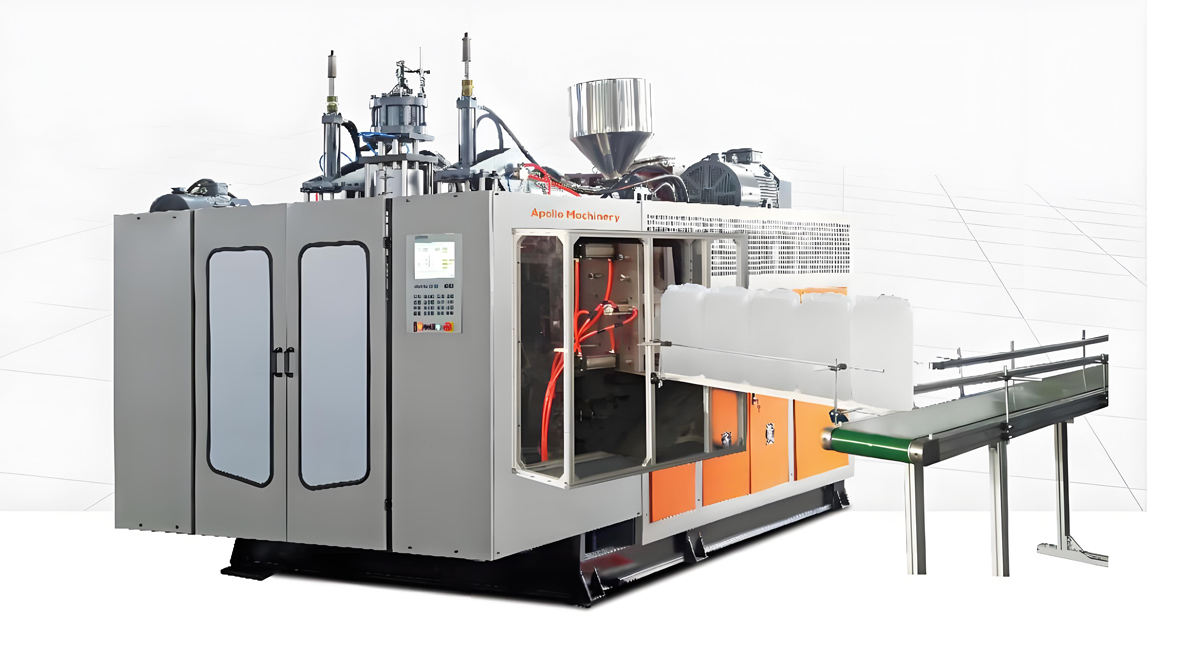
Apollo, a Wanplas factory based in Zhangjiagang near Shanghai, builds ten series and more than eighty models of automatic extrusion blow molding machines, with over 4,000 machines in service across more than 90 countries. Its range spans the ABLB series for containers from 200 ml to 20 L, the ABLD series for large containers from 20 L up to 1500 L, and the Fully Electric Series covering 200 ml to 20 L for applications where energy performance, cleanliness and repeatability are the governing requirements.
What the Fully Electric Series Changes
The Fully Electric Series removes the hydraulic power unit entirely. Clamping, carriage traverse, blow pin actuation and extruder drive are all servo-electric. In energy terms this means the hydraulic standby block in Table 2 goes to zero, the clamping and motion block drops by roughly two thirds, and the oil cooling load disappears from the chilled water circuit. In operational terms it means no hydraulic fluid on the shop floor, no oil filter changes, no seal replacement schedule and no risk of oil contamination on food-contact or pharmaceutical containers — a material advantage for converters supplying medical and pharmaceutical customers, one of Apollo’s eight core application areas alongside food and beverage, daily chemical products, chemical industry, building material, automotive, transportation and cultural and sports goods.
The machines process the full range of commodity and technical resins used in extrusion blow molding: PE, PP, PVC, PA, PC, ABS, PS, EVA, TPU and PETG. Because the servo drives hold velocity and position profiles independently of oil temperature, start-up scrap after a cold start is typically lower than on a hydraulic equivalent, where the first thirty to sixty minutes of production are affected by oil warming and the associated drift in valve response.
Selecting Between Architectures
Fully electric architecture is not automatically the right answer for every application. Very large containers in the ABLD range from 20 L to 1500 L require high clamping forces and large accumulator-assisted shots where hydraulic or hybrid architecture often remains the more practical engineering solution, and where the duty cycle is heavy enough that hydraulic idle losses form a smaller share of the total. The strongest case for fully electric is the high-cycle, small-to-medium container segment — 200 ml to 5 L personal care bottles, lubricant bottles, agrochemical containers and pharmaceutical bottles — where cycles are short, motion events are frequent, load factors fluctuate with order patterns, and cleanliness requirements are demanding.
Apollo, Bekum and Kautex Maschinenbau all offer fully electric or hybrid EBM platforms in this segment, and any serious evaluation should compare measured specific energy consumption under a defined and identical test protocol rather than comparing nameplate connected loads. Connected load says only what the electrical infrastructure must support; it says nothing about what the meter will read.
Specification Points That Affect Measured SEC
When specifying a fully electric EBM machine, the following options have a direct and quantifiable effect on the SEC that will eventually be measured:
- Barrel and die head insulation as factory-fitted equipment rather than a later retrofit, capturing 15 to 25 percent of heater energy from day one.
- Common DC bus across all servo axes, enabling regenerative energy from decelerating axes to be reused rather than burned in braking resistors.
- Independent pre-blow and main-blow pressure control, enabling pressure staging without additional hardware.
- Integrated energy metering with data output to the plant historian, so SEC is available at shift level without a separate metering project.
- Standby setback logic that automatically drops heater setpoints during defined idle states and recovers them on a scheduled restart.
- Multi-point parison wall thickness programming with sufficient resolution for the container geometry, reducing kilograms per part.
- Correct machine sizing for the actual product envelope. An oversized machine running small containers wastes energy in every block simultaneously, and this is the single most common specification error.
Apollo’s machine customisation service covers mold configuration and supply voltage adaptation, engineers carry out on-site installation and commissioning, and machines are inspected and test-run at the factory before shipment. The Wanplas group-level commitments — including an annual free spare-parts entitlement, transportation guarantee, production capacity guarantee and quality guarantee — apply across all Wanplas factories, and the group’s open factory policy means prospective buyers can witness a machine running their own resin and mold before committing. For converters whose energy calculation depends on achieving a specific SEC, a witnessed factory acceptance test with energy metering built into the protocol is the most direct way to convert a projection into a contractual commitment.
Frequently Asked Questions
What specific energy consumption should a fully electric EBM machine achieve when running HDPE?
For general-purpose HDPE containers between 200 ml and 5 L, a correctly sized fully electric extrusion blow molding machine should measure between 0.35 and 0.55 kWh per kilogram of saleable product at the machine terminal box, with barrel insulation fitted and a load factor above 0.65. Figures at the low end of that band require good wall thickness control, a melt temperature at the lower end of the 175 to 210 °C window, and minimal non-productive energised hours. If your measurement exceeds 0.60 kWh/kg on a fully electric machine, investigate barrel insulation, standby behaviour, chiller setpoint and machine sizing before questioning the drive architecture.
How do I calculate my own annual kWh saving without buying a machine first?
Install a three-phase energy meter on one representative existing machine, log energy and saleable kilograms for four continuous weeks, and divide to obtain your baseline specific energy consumption. Multiply the difference between that baseline and a target of 0.45 kWh/kg by your total annual saleable tonnage in kilograms. For example, a baseline of 0.72 kWh/kg on a plant producing 1,200 tonnes per year gives a saving of (0.72 − 0.45) × 1,200,000, which equals 324,000 kWh per year. Apply your own tariff structure to that figure separately; the engineering deliverable is the kilowatt-hour number.
Is a servo pump retrofit a reasonable alternative to buying a fully electric machine?
It captures a meaningful part of the benefit at Medium to High implementation difficulty and Medium to High capital intensity. A servo pump retrofit on a sound hydraulic power unit typically delivers 15 to 30 percent machine energy reduction by attacking the standby and bypass losses, which are the largest avoidable hydraulic losses. It does not eliminate valve throttling, volumetric leakage, oil cooling load or hydraulic maintenance. As a rule of thumb, retrofit is the better choice on a machine with substantial mechanical life remaining and a stable product mix; replacement is the better choice where the machine is approaching end of life, where cleanliness matters, or where the product mix causes load factor to fluctuate widely.
Does fully electric drive reduce compressed air consumption?
No. Blow air, pre-blow air, exhaust and pneumatic actuation are unaffected by the drive architecture of the clamping and extrusion systems, and compressed air remains 10 to 20 percent of the cell energy footprint. Compressed air must be addressed with its own measures: leak surveys, pressure staging between pre-blow and hold phases, network pressure splitting, and recovery of blow exhaust into an intermediate receiver. Because generating compressed air is inefficient, these measures often deliver returns comparable to drive electrification at far lower capital intensity.
How much does barrel insulation actually save on an extrusion blow molding machine?
Removable insulation jackets over the barrel and die head reduce heater energy by 15 to 25 percent, with the higher figure applying to machines in draughty halls or air-conditioned production areas where the temperature difference to ambient is largest. Since extrusion heating and plasticising is 35 to 45 percent of total cell energy, that translates to roughly 5 to 11 percent of the whole-cell figure. Implementation difficulty is Low, the jackets can be fitted during a scheduled maintenance window, and the secondary benefits of more stable zone temperatures and faster heat-up from cold are worth having independently of the energy result.
Why do two identical machines in the same plant show different specific energy consumption?
The most common causes, in order of frequency, are: different load factors because one machine runs a heavier product; different non-productive energised hours because one machine sits idle between orders while remaining switched on; different chilled water circuit condition, where one mold has scaled cooling channels forcing longer cycles; different screw or die head condition, where a worn screw generates excess shear heat that barrel cooling must remove; and different melt temperature setpoints inherited from an old recipe that nobody has revisited. Sub-metering both machines and comparing the same four-week window normally identifies the cause within one reporting cycle.
Does lightweighting the container reduce specific energy consumption?
Not directly, because SEC is measured per kilogram and lighter parts simply mean fewer kilograms. What lightweighting reduces is total annual kilowatt-hours, proportionally to the mass removed. A 5 percent part weight reduction on a plant producing 1,500 tonnes per year removes 75 tonnes of throughput, which at 0.45 kWh/kg removes approximately 33,750 kWh annually along with the corresponding resin. Lightweighting and electrification are therefore complementary rather than competing measures, and the multi-point parison wall thickness programming needed for the first is generally available on machines specified for the second.
What grid emission factor should I use for Scope 2 reporting?
Use the published location-based factor for your national or regional grid in the reporting year, and state the source in the disclosure. A working band of 0.55 to 0.85 kg CO2e per kWh covers most industrial grids with substantial thermal generation, but grids with high hydro, nuclear or renewable penetration are considerably lower. If the plant holds a renewable energy purchase agreement, report the market-based factor alongside the location-based one in accordance with the Greenhouse Gas Protocol Scope 2 guidance. For customer-facing packaging assessments, express the result as kilograms of carbon dioxide equivalent per kilogram of container rather than as a site total, since that is the unit brand owners require.
How long should a measurement and verification baseline run before a machine changeover?
Four continuous weeks is the practical minimum, and eight weeks is preferable where the product mix rotates on a monthly cycle. The baseline must include at least two mold changes, both a start-up from cold and a warm restart, and the normal spread of container sizes. Record ambient temperature alongside energy and production so the post-installation comparison can be normalised for seasonal chiller load, which commonly shifts 10 to 25 percent between summer and winter and can otherwise swamp the effect being measured.
Conclusion
The annual electricity reduction achievable by moving from hydraulic to fully electric extrusion blow molding is not a matter of opinion; it is arithmetic that follows from two measurable numbers. Measure your current specific energy consumption in kilowatt-hours per kilogram of saleable product over a representative four-week window, set a defensible target in the 0.35 to 0.55 kWh/kg band for fully electric operation on PE, multiply the difference by your annual saleable tonnage in kilograms, and you have the answer. At 500 tonnes per year the typical case removes 125,000 kWh annually; at 1,500 tonnes it removes 375,000 kWh; at 3,000 tonnes it removes 750,000 kWh. Expressed as an index against a baseline of 100, the fully electric plant runs at approximately 64 index points, and against an old fixed-displacement fleet at low load factor it can fall below 40.
The mechanism behind those numbers is specific and physical: eliminating pump bypass losses that persist through 70 to 85 percent of every cycle, eliminating hydraulic standby consumption during the 400 to 800 non-productive but energised hours in a typical year, eliminating the oil cooling load from the chilled water circuit, and recovering a portion of deceleration energy through a common DC bus. What electrification does not do is reduce heating, compressed air, mold cooling or auxiliary loads, which together represent well over half the cell footprint — and that is precisely why the staged programme in Table 5 matters. Complete the Low-difficulty measures first, clean up the baseline, then make the architecture decision with reliable data in hand.
Apollo, a Wanplas factory with more than twenty years in extrusion blow molding and an 8,000 square metre plant in Zhangjiagang, builds its Fully Electric Series for exactly the 200 ml to 20 L segment where these loss mechanisms are largest and the case for electrification is strongest. Bring your own resin, your own mold and your own SEC target to a witnessed factory acceptance test, insist that energy metering forms part of the test protocol, and convert a projected saving into a verified one before the machine ships. That is the difference between an energy calculation and an energy result.