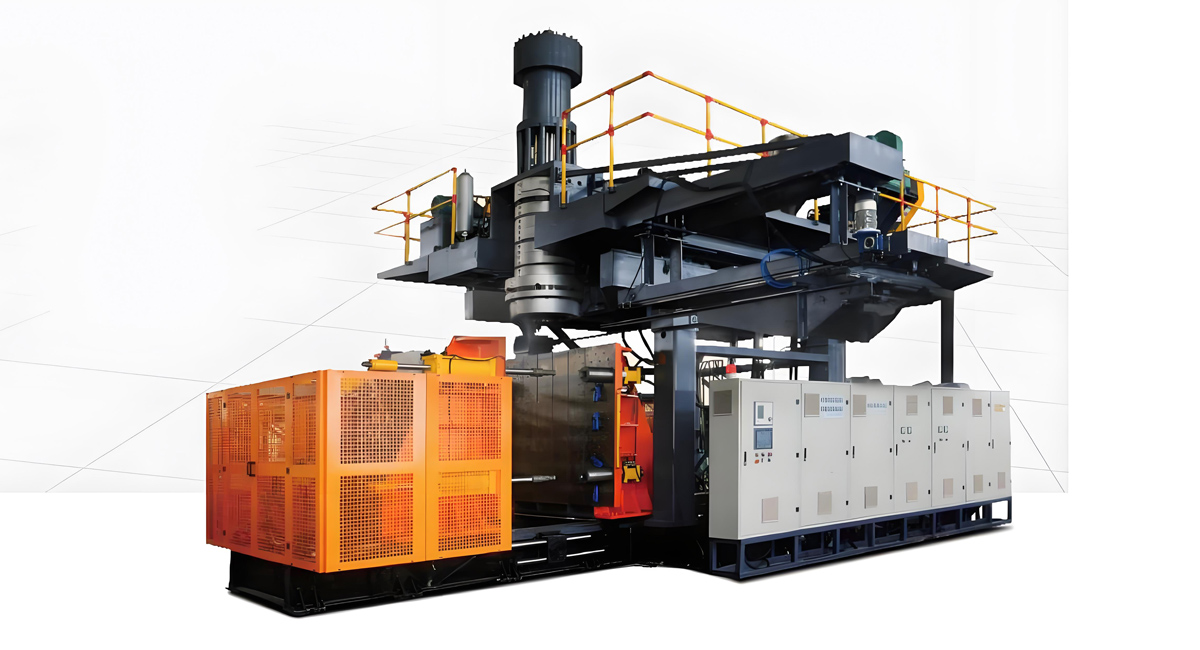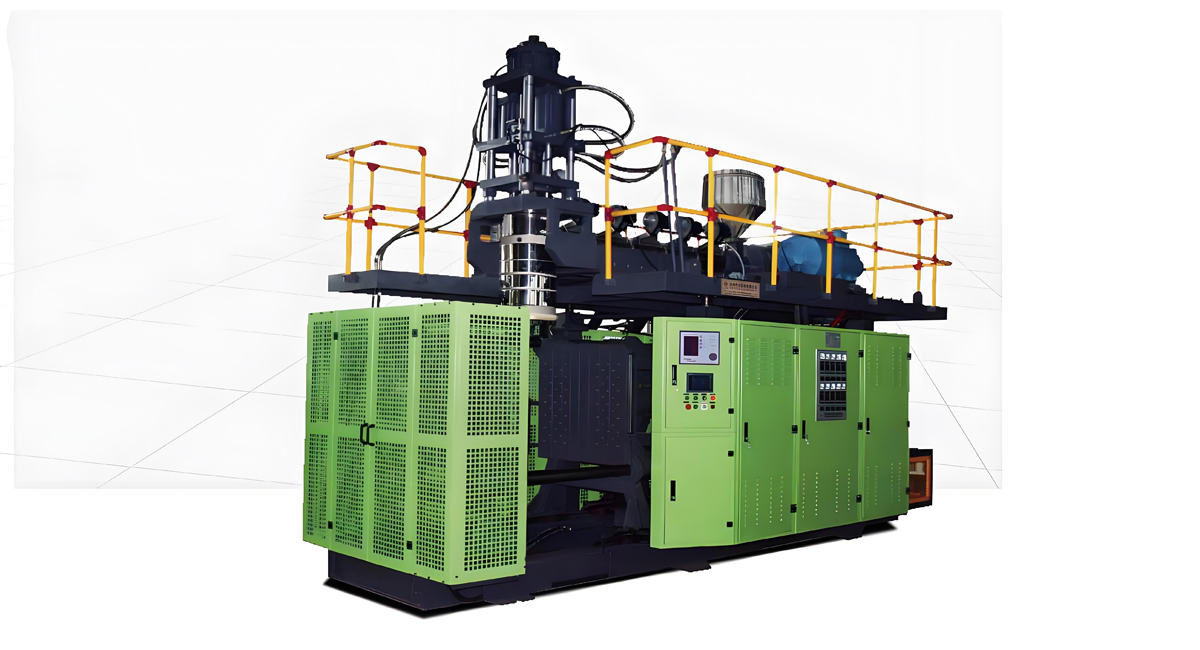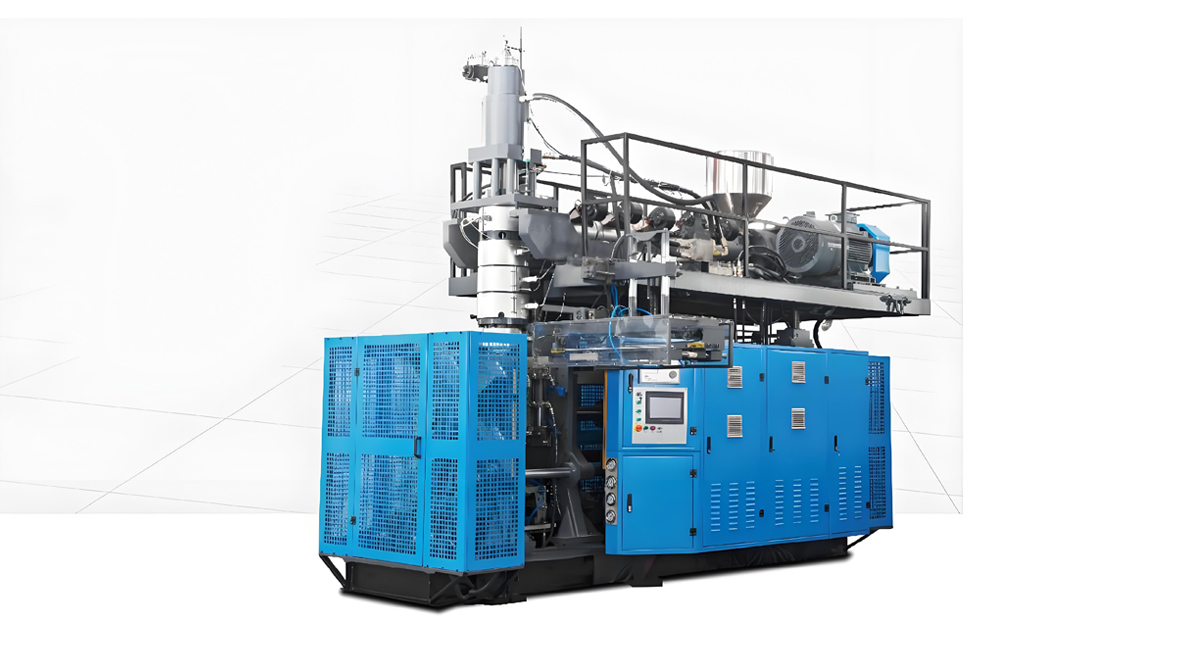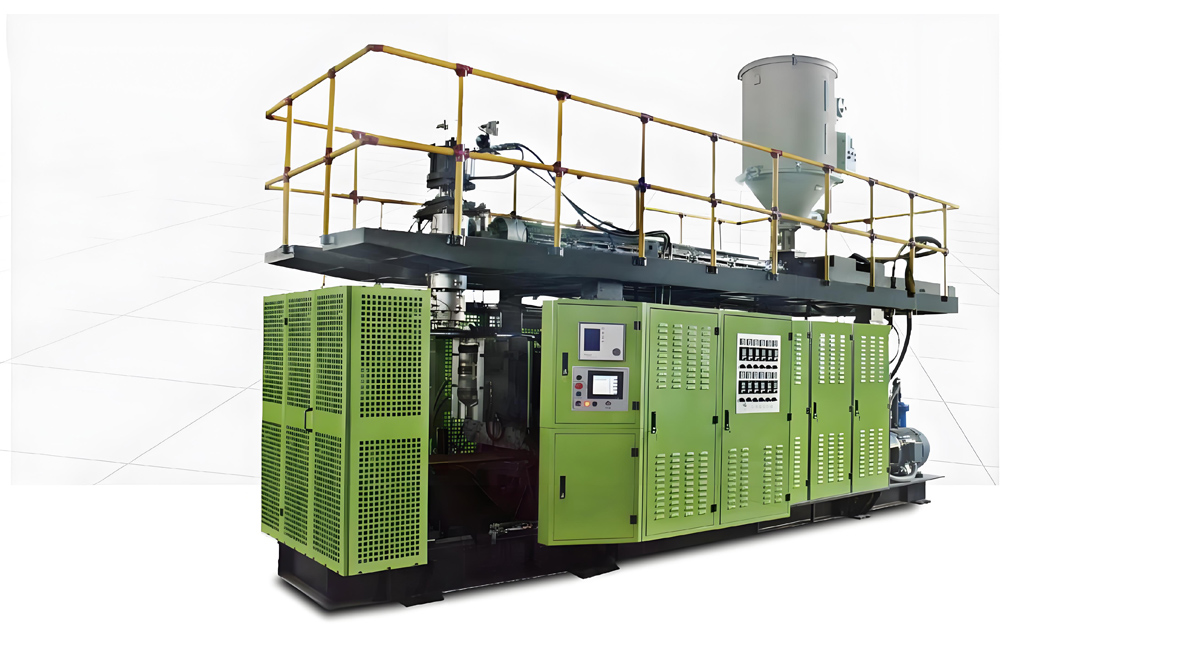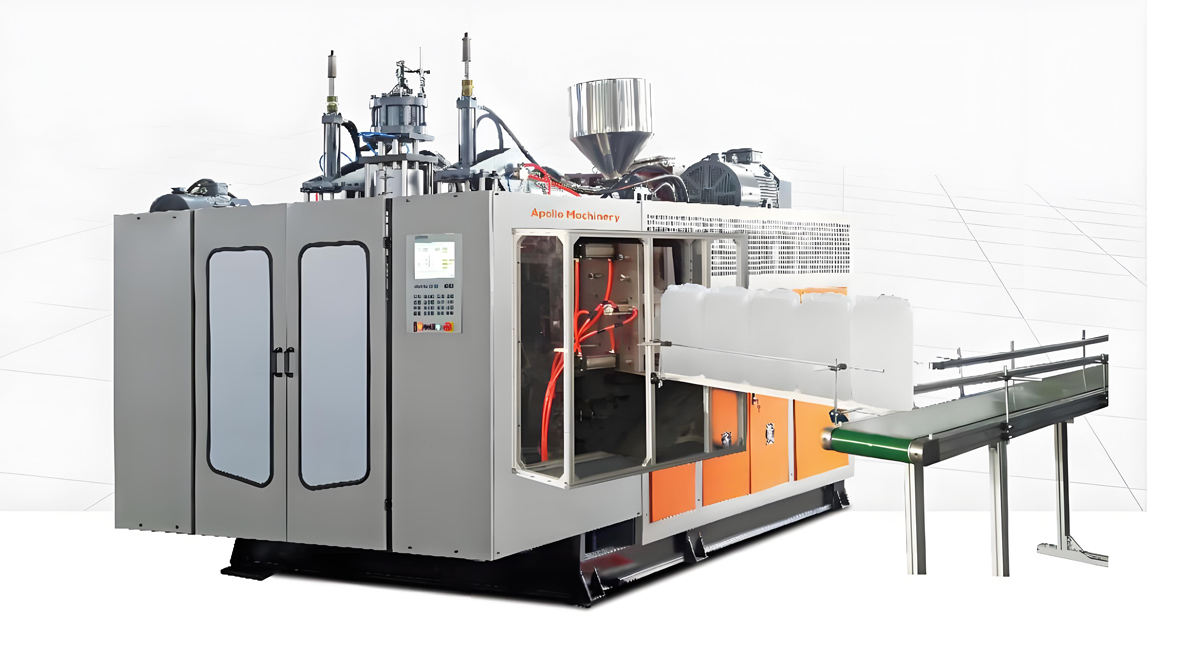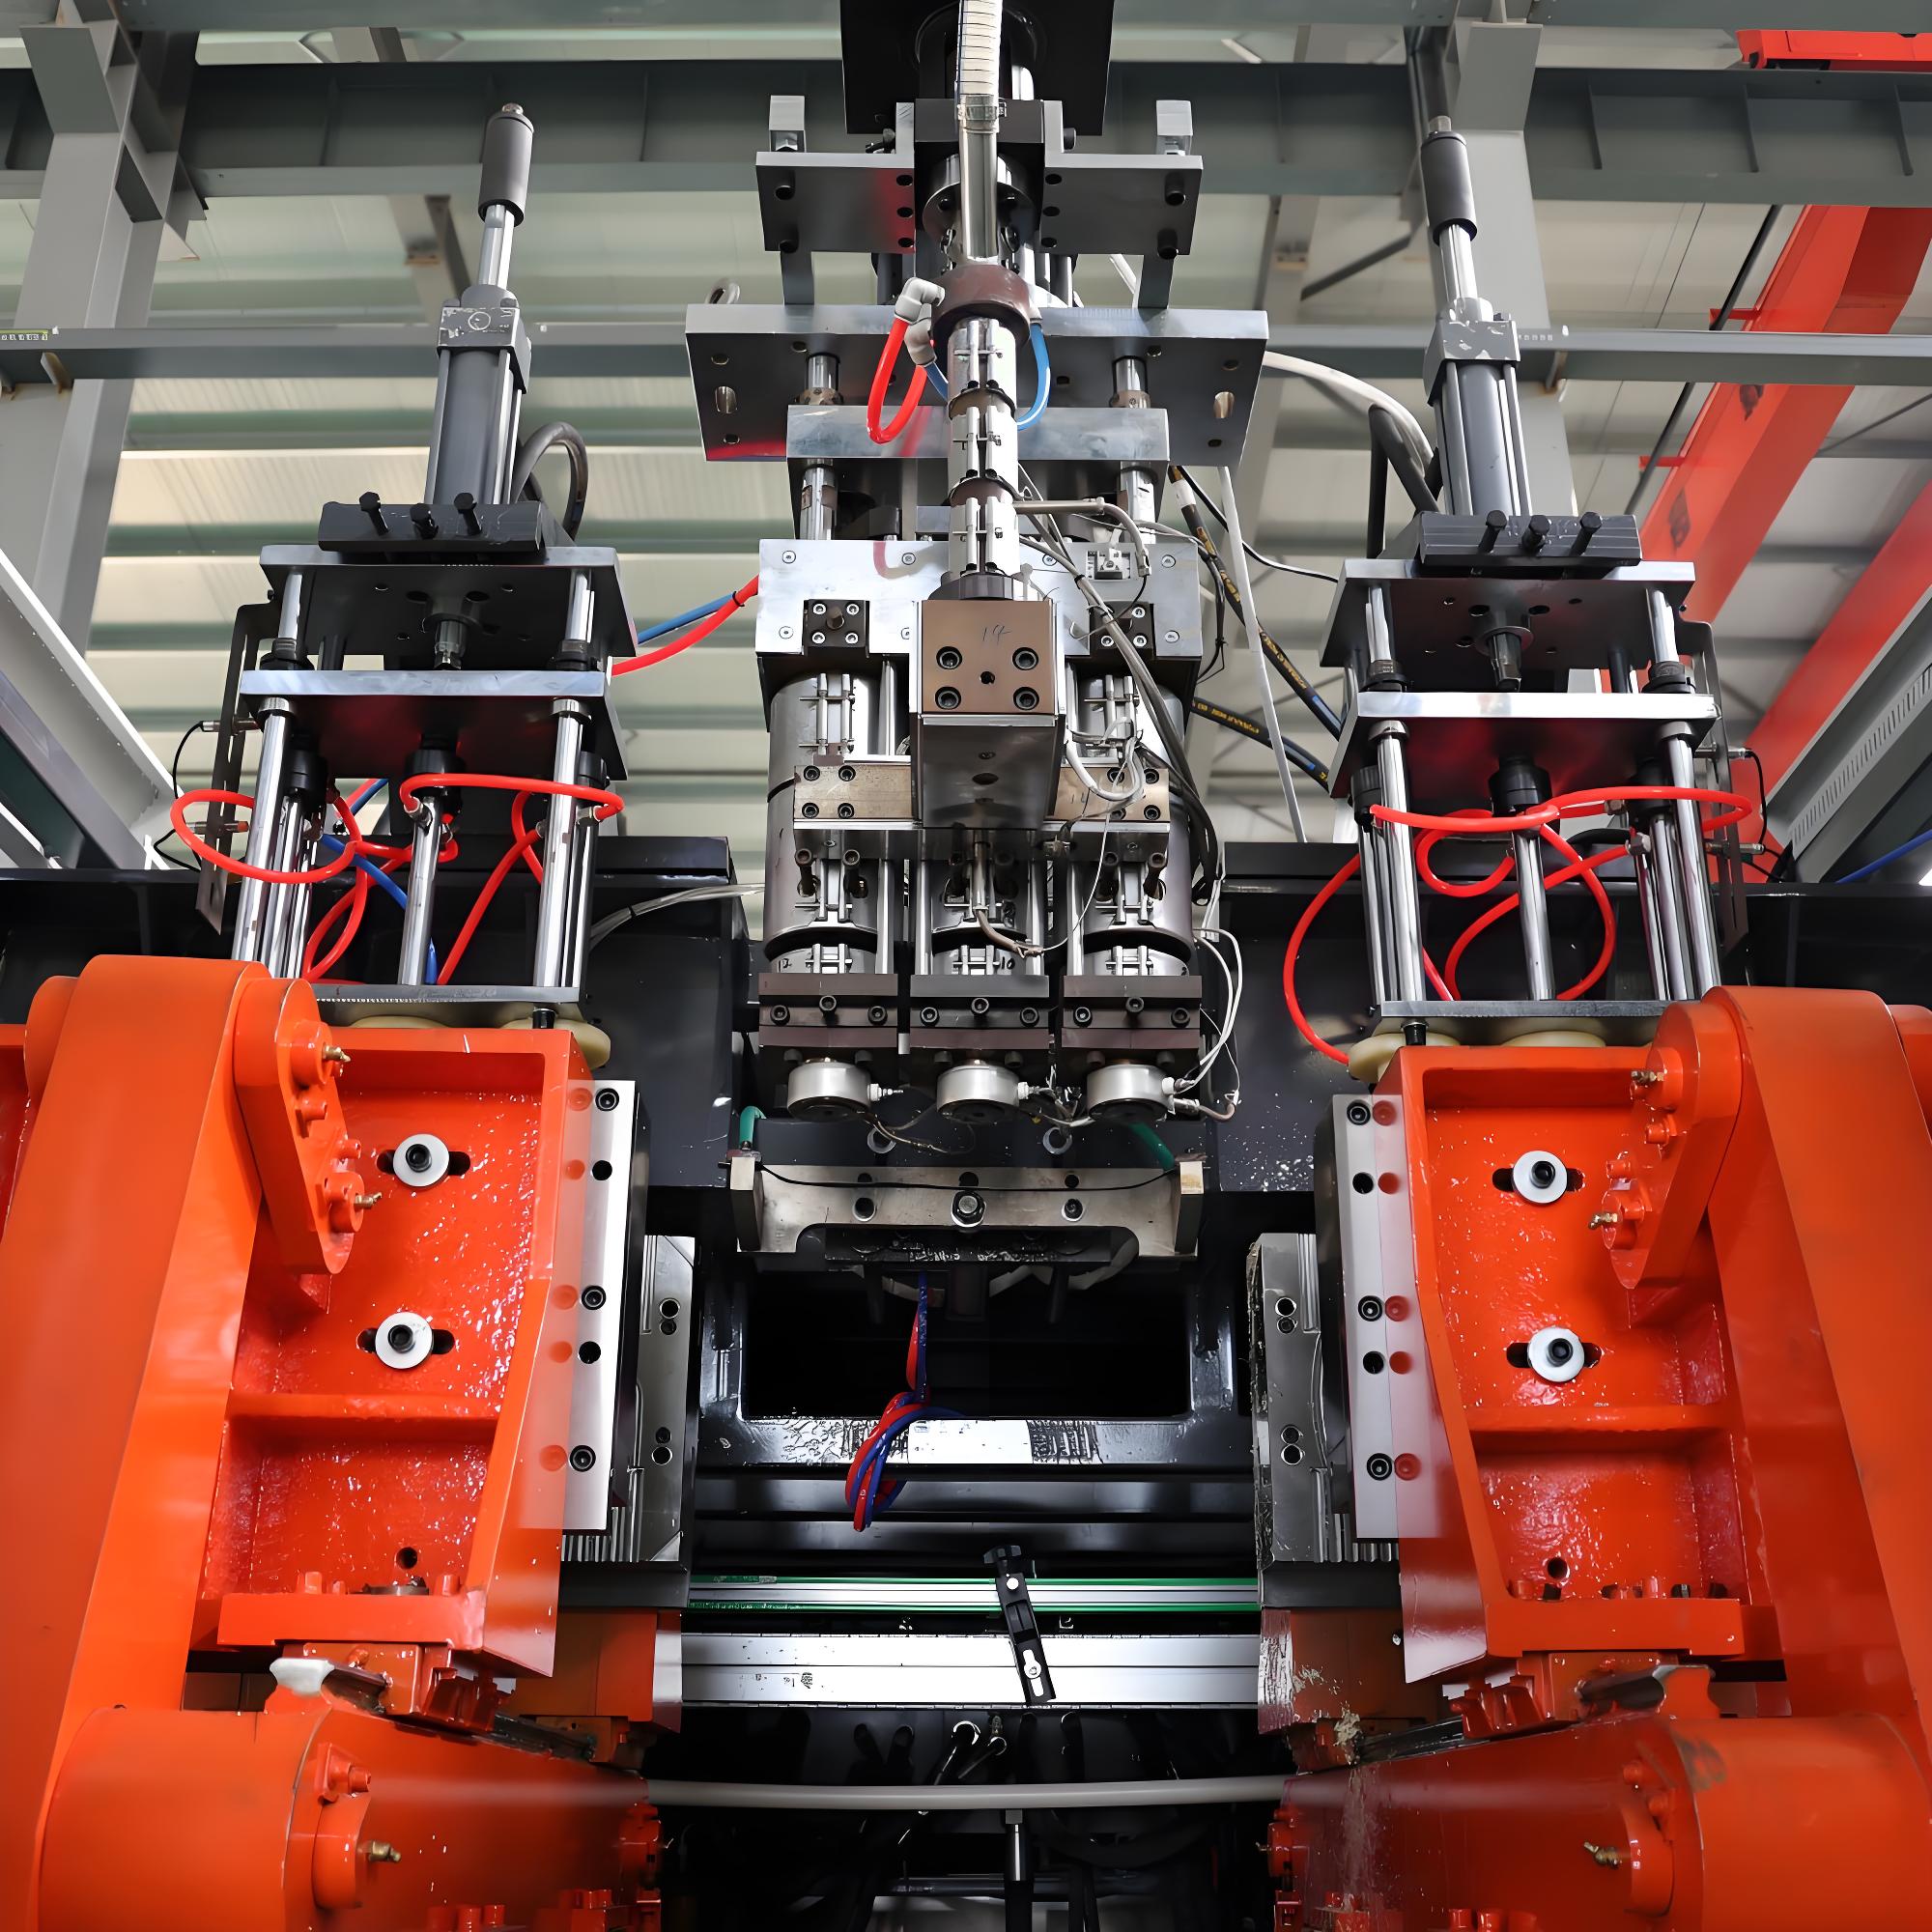

Reducing production cost with high efficiency EBM machines is fundamentally an engineering exercise, not a purchasing negotiation. In extrusion blow molding, the machine itself sets the ceiling on how little resin you can put into a container, how few kilowatt-hours you burn per kilogram extruded, how short the cycle can become, and how many of the containers leaving the deflashing station are actually saleable. A converter running a twenty-year-old fixed-displacement hydraulic machine with 12-point parison programming can optimize process settings all year and still lose to a competitor whose servo hydraulic machine carries 100-point wall thickness control and a properly engineered cooling circuit.
This guide breaks the problem into the four levers that actually move the number: energy, material, cycle time and yield. Each lever is examined with the parameters that matter in the plant, not in the brochure. Apollo, a Wanplas factory in Zhangjiagang with more than twenty years of extrusion blow molding experience and over 4,000 machines running in more than 90 countries, builds ten machine series and over eighty models across the ABLB range for 200 ml to 20 L containers, the ABLD range for large-volume vessels, and a fully electric range for applications where hydraulic oil is unacceptable. The technical positions below reflect what those machines are asked to do in real production environments across food and beverage, daily chemical, chemical industry, building material, medical and pharmaceutical, and automotive applications.
Throughout this article, cost is expressed in relative terms — percentages, multiples, index points against a baseline of 100, and qualitative tiers of Low, Medium, High, Very High and Premium. That is deliberate. Resin, power and labor rates differ by an order of magnitude between regions, but the physics of parison formation, the thermodynamics of container cooling and the electrical behavior of a variable-displacement pump do not. A ratio travels; an absolute figure does not.
- Resin typically represents 45–65% of the converted cost of a blow molded container.
- Specific energy: conventional hydraulic 0.75–1.05 kWh/kg, servo hydraulic 0.45–0.65 kWh/kg, fully electric 0.35–0.50 kWh/kg.
- High-resolution parison programming (100+ points) reduces container weight by 8–15% on profiled geometries.
- Flash ratio on handleware can move from 35% down to 18–22% with tooling and parison work.
- Clean in-house regrind reblending of 20–35% is standard for monolayer HDPE packaging.
- Ceramic and infrared heater bands cut barrel heating energy 25–40% against bare resistance bands.
Why EBM Cost Reduction Is a Machine Decision First
The single most expensive mistake in extrusion blow molding is treating cost reduction as a process-settings problem when it is a machine-capability problem. Process optimization on a machine that lacks the necessary hardware resolution produces small, unstable gains that evaporate the moment the operator changes or the ambient temperature shifts. Hardware capability produces gains that persist because they are structural.
Consider a 5 L HDPE jerrycan produced on two machines with identical resin, identical mold and identical operator skill. Machine A has a 20-point parison programmer, a fixed-displacement pump running continuously against a relief valve, bare resistance heater bands, and a single-station clamp. Machine B has a 100-point programmer with radial wall thickness control, a servo-driven variable-displacement pump, ceramic heater bands with insulation jackets, and a double-station shuttle clamp. Machine B will produce the same functional container at 8 to 15 percent lower part weight, roughly 40 percent lower drive energy, and 25 to 40 percent higher hourly output. Those three advantages compound. They are not additive process tweaks; they are the difference between two cost structures.
This is why the correct sequence for any cost reduction program is: first characterize what your current machine can physically do, then determine which cost line is dominant, then decide whether the gap is closable by settings, by retrofit, or only by machine replacement. Skipping the first step is how plants spend a year chasing 2 percent while a 20 percent structural gap sits untouched.
The four levers, ranked by typical return
- Material. Because resin dominates the cost stack, a 10 percent reduction in grams per container is worth more than a 30 percent reduction in electricity on almost every job. Attack this first.
- Cycle time. Shorter cycles dilute every fixed cost — machine depreciation, mold amortization, labor, facility overhead — across more units. A 15 percent cycle reduction typically removes 5 to 9 percent from converted cost.
- Yield. A rejected container carries the full resin, energy, labor and cycle cost of a good one, plus handling and disposal. Moving first-pass yield from 94 to 98 percent is often the cheapest four points available.
- Energy. Real, measurable and increasingly strategic, but usually a smaller absolute share than the first three. Energy work is also the lever most easily verified, which makes it useful for building internal credibility.
What “high efficiency” actually means in an EBM specification
The phrase is used loosely. In a technical specification it should decompose into measurable claims: specific energy consumption in kWh per kilogram of polymer extruded at rated throughput; parison programming resolution in points, with or without radial control; dry cycle time at stated mold weight and stroke; extruder specific output in kilograms per hour per revolution; cooling circuit design flow and Reynolds number; and demonstrated first-pass yield under a defined product specification. A supplier who can supply all six numbers is describing a machine. A supplier who supplies none is describing a hope.
Breaking Down the Unit Cost of a Blow Molded Container
Before optimizing anything, decompose the converted cost of one container into its constituent lines. The table below reflects typical distributions for mid-volume rigid packaging produced on modern extrusion blow molding equipment. Ranges are wide because container size, resin grade, automation level and regional labor structure all shift the mix, but the ordering is remarkably stable across the industry.
| Cost element | Typical share | Primary drivers | Sensitivity to machine choice |
|---|---|---|---|
| Resin (virgin, before regrind credit) | 45–65% | Part weight, flash ratio, grade selection, scrap rate | Very high — parison control and flash geometry are machine and tooling functions |
| Electricity (extruder, drives, heating, chiller, compressed air) | 6–14% | Drive architecture, heater type, insulation, blow air recovery | Very high — 2 to 3 times spread between architectures |
| Direct labor (operation, deflashing, packing, QC) | 5–15% | Automation level, deflash method, container handling | High — but addressed mainly through downstream automation |
| Mold amortization | 3–8% | Cavitation, mold life, program volume, changeover frequency | Medium — cavity count and quick-change systems dominate |
| Machine depreciation and financing | 5–12% | Capital tier, utilization hours, expected service life | High — diluted by output rate, so cycle time matters |
| Net flash and scrap loss (after regrind recovery) | 2–6% | Flash ratio, regrind cleanliness, thermal degradation, contamination | Very high — closed-loop regrind is a machine and layout decision |
| Downtime and changeover loss | 3–9% | Mold change time, purge losses, start-up scrap, unplanned stops | High — quick mold change and stable control reduce this sharply |
| Maintenance, spares and consumables | 2–5% | Hydraulic service, screw and barrel wear, seals, filters | Medium to high — fully electric machines remove hydraulic service entirely |
| Packaging, utilities and facility overhead | 3–7% | Carton, film, water, HVAC, floor area per output unit | Low to medium |
Reading the table correctly
Three observations follow from this distribution. First, any project that reduces grams of resin per saleable container attacks the largest single block and does so twice — once through purchased resin and once through the flash and scrap line that scales with part weight. Second, energy and labor are frequently over-prioritized relative to their share because they are visible on monthly invoices, while resin waste hides inside a yield number. Third, machine depreciation is not a fixed burden: it is a cost per hour divided by parts per hour, so cycle time compression directly reduces it without touching the machine’s price.
Material grade selection and its cost consequences
Resin grade choice interacts with every other lever. Blow molding grades of HDPE such as 5502 and BL3 class materials are engineered for high melt strength and low melt flow rate, typically in the 0.2 to 0.4 g/10 min range measured under standard conditions, which is what allows a long parison to hang without excessive sag. A higher melt flow rate grade extrudes with less motor load and less specific energy, but sags faster, forcing shorter parisons, thicker safety margins or accumulator operation — and the resulting weight penalty usually exceeds the energy saving. This is the classic false economy in EBM.
Polypropylene grades such as R370Y class random copolymers offer clarity and higher service temperature for hot-fill and pharmaceutical containers, but their narrow processing window and lower melt strength demand tighter melt temperature control, typically within plus or minus 2 degrees Celsius across barrel zones, and often a die head with improved thermal homogeneity. PETG is used where clarity and chemical resistance justify a Premium material tier; it requires careful drying to a low residual moisture level and lower shear to avoid hydrolytic degradation, and its scrap sensitivity makes flash reduction disproportionately valuable. Density verification per ASTM D1505 and impact behavior per ASTM D2561 for environmental stress crack resistance in blow molded containers are the standard references converters use to confirm that a grade substitution has not quietly moved a container outside specification.
Energy Optimization: Drive Architecture, Heating and Heat Recovery
Energy consumption in extrusion blow molding divides into three roughly comparable blocks: the extruder drive that melts and pumps polymer, the hydraulic or electric motion system that clamps, shuttles, blows and ejects, and the thermal services comprising barrel heating, chilled water and compressed air. Each responds to different interventions, and the largest single spread comes from drive architecture.
Drive architecture: the 2 to 3 times spread
A conventional fixed-displacement hydraulic EBM machine runs its pump continuously at system pressure. Whenever no movement is demanded — which on a typical cycle is the majority of the time — that flow bypasses over a relief valve and converts directly into heat in the oil, which the cooling system must then remove, consuming further energy. Servo hydraulic systems replace this with a servo motor driving a variable-displacement pump that turns only when flow is required and at only the speed required. Fully electric machines eliminate the hydraulic circuit entirely, using servo-driven ball screws and toggle mechanisms for clamping and carriage motion, with regenerative braking recovering deceleration energy.
| Parameter | Conventional hydraulic | Servo hydraulic | Fully electric |
|---|---|---|---|
| Specific energy (kWh per kg extruded) | 0.75–1.05 | 0.45–0.65 | 0.35–0.50 |
| Reduction against conventional baseline | Baseline (100 index points) | 55–70 index points | 40–55 index points |
| Idle and standby draw | High — pump runs continuously | Low — near zero between movements | Very low — servo axes at rest |
| Oil cooling load | High | Reduced 50–70% | None |
| Motion repeatability | Moderate, drifts with oil temperature | Good | Excellent, temperature independent |
| Clamp and carriage noise level | High | Medium | Low |
| Hydraulic maintenance burden | High — oil, filters, seals, hoses | Medium | None |
| Capital tier | Low | Medium to High | Premium |
| Best fit | Low utilization, large-volume ABLD-class vessels, budget-constrained lines | Most mid to high volume packaging programs, 0.1–20 L | High utilization, small containers, cleanroom, pharmaceutical, oil-free requirements |
The practical reading: for a plant running two or three shifts on containers between 0.1 L and 20 L, servo hydraulic architecture is usually the highest-return choice, because it captures most of the available energy saving at a materially lower capital tier than fully electric. Fully electric becomes decisive where oil contamination is unacceptable — pharmaceutical, medical and certain food contact applications governed by EU 10/2011 and FDA 21 CFR 177.1520 — or where utilization exceeds roughly 6,000 hours per year and the remaining 15 to 25 percent energy advantage compounds into a meaningful figure. Apollo’s fully electric series covering 200 ml to 20 L exists precisely for that segment, alongside the hydraulic and servo hydraulic ABLB and ABLD ranges.
Barrel heating: bands, insulation and the standby problem
Barrel heating is often dismissed as a small load because the steady-state duty cycle after warm-up is low. That reasoning ignores two facts: the barrel and die head radiate continuously into the plant, and that radiated heat is then removed again by the facility ventilation. Replacing bare resistance heater bands with ceramic or infrared bands, and adding insulation jackets, addresses both sides of the ledger.
| Heating approach | Energy against bare resistance baseline | Heat-up behavior | Notes |
|---|---|---|---|
| Bare resistance (mica) bands | Baseline (100 index points) | Fast, high radiation loss | Lowest capital, highest steady-state loss, hottest working environment |
| Ceramic bands with insulation | 60–75 index points | Slightly slower heat-up, very stable | 25–40% saving typical; excellent for long continuous runs |
| Infrared bands | 65–80 index points | Fast, efficient radiant transfer to barrel | 20–35% saving typical; good response for frequent grade changes |
| Insulation jackets on existing bands | 80–88 index points | Unchanged | 12–20% saving as a retrofit; among the cheapest interventions available |
| Induction heating | 50–70 index points | Very fast, tight control | Highest capital tier; justified on high-value or fast-changeover operations |
Insulation jackets deserve particular attention because they are a retrofit, require no control change, and typically pay back faster than any other energy measure on the list. They also lower ambient temperature around the machine, which reduces HVAC load and improves operator comfort — a second-order benefit that rarely appears in the calculation but is real.
Variable frequency drives, chiller strategy and heat recovery
Three further measures round out the energy program. First, variable frequency drives on extruder main motors, chilled water pumps and cooling tower fans convert fixed-speed loads into demand-following loads; pump and fan power scales roughly with the cube of speed, so a 20 percent speed reduction removes close to half the power. Second, chiller strategy matters more than chiller size: separating the mold cooling circuit at 8 to 12 degrees Celsius from the hydraulic oil and gearbox cooling circuit at 25 to 30 degrees Celsius allows the higher-temperature loop to run on a free-cooling tower for much of the year rather than on mechanical refrigeration.
Third, waste heat recovery. An extrusion blow molding line rejects substantial low-grade heat through the oil cooler, the air compressor aftercooler and the barrel surface. Capturing the compressor and oil cooler heat into a plant hot water loop for resin pre-drying, washdown or space heating is straightforward engineering with no impact on the molding process. Compressed air itself deserves scrutiny: blow air at 6 to 10 bar for container inflation is one of the most expensive utilities per unit of energy delivered, and blow air recovery systems that recapture the exhaust from each blow cycle into a low-pressure receiver for pre-blow or pneumatic services routinely cut compressed air consumption by 20 to 35 percent on high-cavitation machines.
Material Cost Optimization: Parison Programming, Co-extrusion and Regrind
Material is the largest cost block and the one where high efficiency EBM machines create the widest separation from legacy equipment. Three mechanisms dominate: distributing polymer only where the container needs it, replacing expensive polymer with cheaper polymer in layers that do not require the expensive property, and recovering everything the process rejects.
Parison programming: from 20 points to 100 points and beyond
Parison programming controls the axial wall thickness profile of the extruded tube by moving the die or mandrel during extrusion. The resolution of that control — the number of discrete points across the parison length — determines how closely the extruded thickness profile can match the container’s actual requirement after blowing. A container is not a uniform object: the shoulder and base see the highest blow ratio and thin the most, handle areas and pinch-off zones need reinforcement, and long straight sections need only enough wall to meet top-load and stiffness targets.
With 12 to 20 points, the programmer can only apply coarse steps, forcing the operator to over-thicken entire zones to protect the single thinnest location within each step. With 100 points or more, the profile follows the requirement closely, and the safety margin collapses from a zone-wide allowance to a point-wide allowance. On profiled geometries this yields 8 to 15 percent container weight reduction at unchanged functional performance. On simple straight-wall geometries the gain is smaller, typically 3 to 6 percent, because there is less profile to follow.
Radial wall thickness control — sometimes described as partial wall thickness or die deformation control — adds a second dimension by deforming the die gap circumferentially. This matters for oval, offset-neck, handled and non-round containers, where the blow ratio varies around the circumference as well as along the height. Combining 100-point axial programming with radial control on a handled 5 L jerrycan is where the upper end of the 8 to 15 percent range is realized.
- Section a current production container on a grid and map actual wall thickness at every point, not just the nominal check locations.
- Identify the functional minimum at each zone from top load, drop test per the applicable container standard, and environmental stress crack resistance requirements.
- Reduce the programming profile in 2 percent weight steps, holding all other parameters constant.
- Re-test top load, drop and capacity at each step; stop one step before any indicator crosses the specification limit.
- Run the accepted profile for a minimum of two full production weeks before locking it into the recipe.
Multi-layer co-extrusion: putting expensive polymer only where it works
Multi-layer co-extrusion is the second material lever and is frequently misunderstood as a barrier technology only. It is equally a cost technology. A three-layer structure allows the middle layer to carry regrind, recycled content or a lower-cost filled compound while the inner and outer layers carry the virgin, food-contact-compliant or pigmented material. A five-layer or six-layer structure adds EVOH with tie layers, delivering oxygen barrier at an EVOH content of typically 2 to 6 percent of total wall thickness rather than requiring an expensive barrier polymer throughout.
| Structure | Typical layer function | Material cost effect | Typical application |
|---|---|---|---|
| Monolayer | Single HDPE or PP wall | Baseline (100 index points) | General packaging, chemical containers, daily chemical bottles |
| 3-layer (virgin / regrind / virgin) | Outer and inner virgin, core carries 30–50% regrind | 82–92 index points on material | Detergent, lubricant, agrochemical containers |
| 3-layer (color / natural / color) | Pigment confined to thin skins | 88–95 index points; masterbatch use cut 40–60% | High-pigment-load colored bottles |
| 5-layer with EVOH | PE / tie / EVOH / tie / PE | 105–120 index points but replaces a full barrier alternative | Food sauces, agrochemicals, solvent packaging |
| 6-layer with EVOH and regrind | PE / regrind / tie / EVOH / tie / PE | 95–110 index points with full barrier performance | Fuel and solvent containers, extended shelf-life food |
The color-layer case is worth isolating. Pigment and masterbatch carry a Very High cost tier per kilogram compared with base resin. Confining color to two skin layers of 8 to 12 percent of total wall thickness each cuts masterbatch consumption by 40 to 60 percent while producing an indistinguishable visual result, because the eye only reads the outer surface. Many converters running heavily pigmented containers on monolayer machines are effectively paying pigment prices for the entire wall.
Flash ratio: the difference between 35 percent and 20 percent
Flash is polymer that was extruded, heated, blown and then cut away. Even with perfect in-house recovery it costs money: it consumes extruder capacity, absorbs energy twice, occupies cycle time, degrades slightly with each pass, and requires granulating, conveying and blending equipment. A container running 35 percent flash is asking the extruder to produce roughly 1.54 kilograms of melt for every 1 kilogram of saleable container. At 20 percent flash that ratio falls to 1.25, which is a 19 percent reduction in required extruder throughput for the same saleable output — capacity that becomes available for more production without buying another machine.
Reducing flash ratio is a combined tooling and parison exercise:
- Pinch-off geometry. Excessively wide pinch-off lands generate wide flash webs. Reworking land width and pinch angle to the minimum that still produces a sound weld is often worth 3 to 6 percentage points of flash ratio on its own.
- Parison length control. Extruding a parison longer than the mold requires, as insurance against short shots, is common and expensive. Tight cut-off timing linked to the programmer removes the excess tail.
- Die and mandrel sizing. An oversized die gap forces a heavier parison at any given programming profile. Matching die and mandrel to the actual container weight target restores the programmer’s working range.
- Mold shut height and clamp parallelism. Drift here produces variable flash thickness and forces the operator to add wall thickness margin to protect against thin spots.
- Handle and neck flash design. On handleware, the handle window and neck moil frequently contribute more flash than the entire body pinch. Redesigning these zones is where the largest single reductions typically appear.
Regrind: 20 to 35 percent reblending and melt flow rate drift control
In-house regrind is free material only if it re-enters the process without damaging the product. The controlling variable is thermal history. Each pass through the extruder subjects HDPE to shear and heat that produces chain scission or, with some grades and additive packages, mild crosslinking. Either way the melt flow rate drifts. Drift in melt flow rate changes melt strength, which changes parison sag, which changes the wall thickness distribution the programmer was tuned to produce.
Practical control rules that hold across most monolayer HDPE packaging operations:
- Blend clean in-house regrind at 20 to 35 percent for general packaging; keep it below 15 percent for containers with demanding environmental stress crack resistance requirements.
- Measure melt flow rate on the blended feed at least once per shift when regrind exceeds 25 percent, and reject the blend if it deviates more than plus or minus 15 percent from the virgin reference value.
- Limit material to two thermal passes before diverting it to a lower-specification product or an external recycling stream.
- Granulate flash while it is still warm but fully dimensionally stable — typically within one to two minutes of deflashing — to reduce granulator energy and fines generation.
- Control fines: keep the fraction below 300 micrometers under 3 percent of regrind mass, because fines melt early, cause feeding irregularity and disproportionately degrade.
- Use gravimetric blending rather than volumetric. Bulk density differences between granulated flash and virgin pellets make volumetric blending inaccurate by 5 to 15 percent, which propagates directly into weight variation.
- Keep regrind dry and covered. Absorbed moisture in HDPE is minor but surface moisture on flake causes screw slippage and surface defects.
For food contact containers, regrind reuse must remain within the scope of the applicable compliance framework. Closed-loop in-house regrind of a compliant material is generally acceptable under EU 10/2011 and FDA 21 CFR 177.1520 provided the material has not been contaminated by product contact or foreign material, but the converter carries the documentation burden. An ISO 9001 quality system with material traceability from silo to container is the practical mechanism for discharging it.
Cycle Time Compression: Cooling, Air Management and Station Layout
Cycle time in extrusion blow molding is dominated by cooling. For a typical HDPE container, cooling accounts for 55 to 75 percent of total cycle, with clamp movement, blow, exhaust and ejection filling the remainder. Every second removed from cooling therefore has an outsized effect, and cooling is fundamentally a heat transfer problem governed by mold design and water circuit engineering, not by machine settings.
Mold cooling circuit design
Three parameters determine cooling performance: channel proximity to the cavity surface, flow turbulence, and coolant temperature. Conventional drilled straight channels must respect mold strength and manufacturability, which forces them away from the cavity surface in exactly the regions — shoulders, handles, base pinch — where the polymer is thickest and slowest to cool. Conformal cooling channels, produced by additive manufacturing or by laminated insert construction, follow the cavity contour at a consistent 6 to 10 millimeter offset and eliminate those hot zones.
Flow turbulence is the most commonly wasted opportunity. Heat transfer improves dramatically once flow becomes turbulent, and the practical threshold is a Reynolds number above 4,000 in every circuit. Many molds are plumbed with oversized manifolds and long series circuits that produce laminar flow at the delivered pump pressure; the water passes through, absorbs relatively little heat, and returns to the chiller barely warmed. Splitting long series circuits into shorter parallel circuits, each individually flow-metered and balanced, is inexpensive and frequently removes 8 to 15 percent from cooling time with no other change.
Coolant temperature between 8 and 12 degrees Celsius is the usual optimum for HDPE containers. Colder water increases the temperature gradient and shortens cooling further, but risks condensation on mold surfaces in humid plants, which produces surface marks and corrosion, and it raises chiller energy consumption disproportionately. Where lower temperatures are used, the mold and the plant environment must be managed together, with dehumidified enclosure air around the clamp area.
Internal cooling and air management
The container cools from both sides. External cooling comes from the mold; internal cooling comes from the blow air. Static blow air quickly reaches thermal equilibrium with the inner surface and stops removing heat. Internal air exchange systems replace that warmed air continuously through a dual-passage blow pin, delivering fresh air in and exhausting warmed air out throughout the cooling phase. On thick-wall containers above 5 L, internal air exchange commonly removes 15 to 30 percent of total cycle time. On thin-wall containers below 1 L, the benefit is smaller because the wall cools quickly from the mold side alone.
Valve response time is the other air-side variable. The blow, exhaust and pre-blow valves must open and close crisply; sluggish valves add tenths of a second at several points in every cycle, which compounds into a measurable output loss over a shift. Large-bore, short-stroke poppet valves mounted close to the blow pin, with adequately sized exhaust porting, are the correct specification. Exhaust is frequently undersized — designers focus on getting air in and neglect getting it out, and the container cannot be demolded until pressure has fully released.
Station architecture and cavitation
Machine layout determines how much of the cycle is productive. A single-station machine extrudes, clamps, blows, cools and ejects in sequence; the extruder continues producing during the mold-closed phase, and the parison must either be accumulated or handled by a moving die head. A double-station shuttle machine alternates two molds under one die head, so one mold cools while the other receives a parison, converting cooling time from serial to parallel. This is the single most effective architectural change for cooling-limited containers.
| Configuration | Relative output index | Cost per unit index | Best suited to |
|---|---|---|---|
| Single station, 1 cavity | 100 | 100 | Large vessels, low volume, frequent changeover, sampling |
| Single station, 2 cavities | 185–195 | 62–70 | Mid-volume containers 1–5 L |
| Double station (shuttle), 1 cavity each | 155–180 | 68–78 | Cooling-limited thick-wall containers 5–30 L |
| Double station, 2 cavities each | 300–350 | 45–55 | High-volume 0.5–5 L packaging programs |
| Single station, 4 cavities | 355–385 | 42–50 | High-volume small containers 0.1–1 L |
| Single station, 6 cavities | 510–560 | 36–44 | Very high volume small containers, pharmaceutical and daily chemical |
| Single station, 8 cavities | 660–730 | 32–40 | Dedicated long-run programs, 0.1–0.5 L |
Cavitation is not free. Every added cavity increases the die head complexity required for even melt distribution, tightens the tolerance demanded of the mold, raises changeover time, and multiplies the consequence of any single cavity drifting out of specification. The output index in the table falls short of linear multiplication for exactly this reason: an 8-cavity machine does not deliver eight times a single cavity, it delivers roughly 6.6 to 7.3 times, because balancing losses and slightly longer clamp cycles absorb the difference. The correct cavitation is the lowest one that meets the program volume with acceptable utilization, not the highest one the machine frame can carry.
Changeover and start-up losses
Cycle time work is undermined if the machine spends hours changing over. Quick mold change systems with pre-heated molds on rolling carts, standardized clamping and quick-disconnect water and air couplings routinely reduce mold change from four hours to under one. Purge losses at grade or color changes are attacked with purging compounds and with sequencing — running light colors before dark, and grouping compatible grades within a production week. Start-up scrap should be measured as a separate line item; on short runs it can exceed the entire flash loss.
Yield and the Hidden Cost of Quality
A rejected container is the most expensive object in the plant: it has absorbed full resin, full energy, full cycle time and full labor, and it now requires handling, granulating and re-processing, or disposal. Moving first-pass yield from 94 to 98 percent removes roughly 4 percent from effective converted cost while consuming no additional resource — which makes yield the highest-leverage lever per unit of investment, provided the machine is capable of holding the tolerance.
Wall thickness uniformity and its downstream consequences
The core quality metric in extrusion blow molding is wall thickness uniformity. A target of plus or minus 5 percent around the programmed profile is achievable on well-controlled modern equipment and is the threshold at which most downstream problems disappear. Above plus or minus 10 percent, the converter is forced into a defensive posture: extra wall thickness everywhere to protect the thinnest statistical outlier, which directly inflates the largest cost line.
Uniformity depends on melt temperature homogeneity across the die head, concentric die and mandrel alignment, stable extruder output free of surging, consistent parison sag behavior, and programmer resolution. Melt temperature variation of more than 3 to 4 degrees Celsius across the annulus produces visible thickness asymmetry. Die head concentricity should be verified at every mold change and after any die or mandrel replacement, not annually.
| Indicator | Typical target | Measurement approach | Cost consequence if out of control |
|---|---|---|---|
| Wall thickness uniformity | ±5% of programmed profile | Sectioning and grid measurement, or ultrasonic gauge | Forces 5–12% weight over-design; largest single hidden cost |
| Container weight variation | ±1.5% of nominal | Statistical weighing, minimum 10 pieces per hour | Direct resin loss; signals extruder surging or blend variation |
| Capacity (brim and fill point) deviation | ±1% of nominal | Gravimetric fill test | Filling line rejects, customer complaints, overfill giveaway |
| Top load resistance | Per customer specification, with 20% margin | Compression tester | Pallet collapse in distribution; catastrophic claim exposure |
| Drop test performance | Pass at specified height, filled and conditioned | Drop test per applicable container standard | Transport failure; usually traced to pinch-off weld quality |
| Environmental stress crack resistance | Per ASTM D2561 methodology for blow molded containers | Bent-strip or filled-container exposure | Delayed field failure weeks after shipment; worst possible failure mode |
| Resin density verification | Per ASTM D1505 gradient method | Density column on incoming lot | Grade substitution errors; shrinkage and stiffness surprises |
| Oxygen transmission rate (barrier containers) | Per product shelf-life requirement | Coulometric OTR measurement on finished container | Product spoilage claims; over-specified EVOH content wastes material |
The pinch-off weld: where most field failures originate
The pinch-off weld at the container base is the most common origin of drop test and field failures, and it is almost always a tooling and process interaction rather than a material defect. A weld that looks acceptable can still be weak if the pinch-off land is too wide, forcing cold material into the weld, or if the mold closes too slowly, allowing the parison to cool before the pinch completes. Correct practice is a narrow land with a defined pinch angle, a fast clamp closing speed through the pinch stroke, and adequate melt temperature at the parison base. Sectioning welds from production containers and examining them under magnification once per shift on critical products is cheap insurance.
Environmental stress crack resistance and the regrind interaction
Environmental stress crack resistance deserves separate attention because it is the failure mode that appears weeks after shipment, when the entire lot is already in the market. It is sensitive to molecular weight distribution, residual stress from rapid cooling, wall thickness thin spots, and regrind content. A container that passes drop and top load can still fail environmental stress cracking if regrind ratio was pushed too high or if a thin spot coincides with a stressed radius. This is the technical reason for the 15 percent regrind ceiling on demanding applications noted earlier, and it is why weight reduction programs must include environmental stress crack testing rather than stopping at mechanical tests.
Inspection strategy
Yield improvement requires detection close to the source. Weight-based in-line checking is the most efficient single method in extrusion blow molding because container weight correlates with almost every wall thickness fault; a checkweigher immediately after deflashing with automatic rejection and an alarm at plus or minus 2 percent catches drift before it becomes a lot. Leak testing is mandatory for liquid packaging and should be positioned to feed its reject data back to the specific cavity, which requires cavity identification marking. Vision inspection for neck finish and body defects supplements but does not replace weight control. Quality standards such as ISO 9001 for the management system and national standards such as GB/T 17931 for blow molded container requirements provide the documentation structure customers expect to audit.
Optimization Matrix: Savings Against Implementation Difficulty
Not all cost reduction measures deserve equal priority. The matrix below ranks the practical interventions by the reduction they typically deliver against total converted cost, the capital tier required, and the implementation difficulty in an operating plant. Measures in the upper-left region — meaningful savings at Low capital and Low difficulty — should be executed before anything else, regardless of how modest they appear individually.
| Measure | Reduction in converted cost | Capital tier | Implementation difficulty | Typical time to result |
|---|---|---|---|---|
| Barrel and die head insulation jackets | 0.3–0.8% | Low | Low | Immediate |
| Cooling circuit re-balancing to turbulent flow | 1.5–3.5% | Low | Low | Days |
| Parison programming profile re-optimization (existing hardware) | 2–5% | Low | Medium | Two to four weeks with testing |
| Gravimetric regrind blending replacing volumetric | 0.8–2% | Low to Medium | Low | Weeks |
| Checkweigher with cavity-level feedback | 1.5–4% | Low to Medium | Low | Weeks |
| Variable frequency drives on pumps and fans | 0.4–1.2% | Medium | Low | Weeks |
| Ceramic or infrared heater band conversion | 0.5–1.5% | Medium | Low | One planned shutdown |
| Pinch-off and flash geometry rework on existing molds | 3–7% | Medium | Medium | Four to eight weeks |
| Blow air recovery system | 0.5–1.5% | Medium | Medium | Weeks |
| Internal air exchange blow pins | 2–6% | Medium | Medium | Weeks, with mold interface work |
| Quick mold change system | 1–4% | Medium | Medium | Months, includes cart and fixture build |
| Conformal cooling mold inserts | 3–8% | High | High | Three to six months |
| Servo hydraulic drive retrofit or replacement | 2–5% | High | Medium to High | Months |
| High-resolution parison programmer upgrade (100+ points) | 4–9% | High | Medium | Months |
| Increased cavitation with new tooling and die head | 6–14% | High to Very High | High | Six months plus |
| Multi-layer co-extrusion conversion (3 or 5 layer) | 5–15% | Very High | High | Six to twelve months |
| Fully electric machine replacement | 4–10% | Premium | High | Twelve months including qualification |
How to sequence a program from this matrix
Execute in three waves. Wave one takes every Low capital, Low difficulty item within the first quarter — insulation, cooling balance, gravimetric blending, checkweighing, programming re-optimization on existing hardware. These typically aggregate to 6 to 12 percent of converted cost and require no capital approval cycle, which also builds the internal credibility needed for the later waves.
Wave two addresses the Medium tier over the following two to three quarters — pinch-off rework, internal air exchange, heater conversion, quick mold change, variable frequency drives. These require engineering time and planned downtime but no strategic decision. Wave three is the capital tier: cavitation increase, programmer upgrade, drive architecture change, co-extrusion conversion, machine replacement. By the time wave three is proposed, waves one and two have produced measured data on the same product, which is exactly the evidence base needed to justify it.
Machine Selection: Matching Model, Screw and Cavitation to the Job
Selecting the wrong machine size is a permanent cost penalty that no amount of process optimization can recover. An oversized extruder runs at low screw speed with long residence time, degrading polymer and wasting standby energy; an undersized extruder becomes the cycle bottleneck and forces the operator into higher melt temperatures that worsen parison sag. The table below gives working selection guidance across the container range Apollo’s ABLB and ABLD series address.
| Container capacity | Screw diameter | L/D ratio | Typical cavities and stations | Clamping force (kN) | Typical output (pcs/h) | Recommended drive |
|---|---|---|---|---|---|---|
| 0.1–0.5 L | 45–55 mm | 24:1–25:1 | 4 or 6 cavity, single station | 45–70 | 2,400–4,800 | Fully electric or servo hydraulic |
| 0.5–1.0 L | 55–65 mm | 25:1–26:1 | 2 or 4 cavity, single station | 60–95 | 1,600–3,000 | Fully electric or servo hydraulic |
| 1.0–2.0 L | 65–75 mm | 25:1–28:1 | 2 or 4 cavity, single or double station | 90–140 | 900–1,900 | Servo hydraulic |
| 2.0–5.0 L | 75–90 mm | 26:1–28:1 | 1 or 2 cavity, double station preferred | 140–220 | 480–950 | Servo hydraulic |
| 5.0–10 L | 90–100 mm | 28:1–30:1 | 1 or 2 cavity, double station | 210–300 | 220–460 | Servo hydraulic |
| 10–20 L | 100–110 mm | 28:1–30:1 | 1 cavity, double station | 290–380 | 140–270 | Servo hydraulic |
| 20–30 L | 110–120 mm | 30:1 | 1 cavity, single station with accumulator | 360–460 | 70–130 | Servo hydraulic or accumulator hydraulic |
Output figures assume HDPE containers at standard wall thickness, mold water at 8 to 12 degrees Celsius, and 90 percent machine availability. Actual figures shift with container geometry, wall thickness, resin grade and ambient conditions, and every serious selection exercise should be confirmed with a trial run on the specific container before contract.
Reading the screw and L/D specification correctly
Screw diameter sets throughput capacity; L/D ratio sets melting quality and mixing. A 24:1 screw melts adequately for straightforward HDPE at moderate output but leaves limited length for homogenization. A 28:1 to 30:1 screw provides better melt temperature uniformity across the annulus, which translates directly into better wall thickness uniformity and therefore lower weight. The longer screw also permits lower melt temperature at the same output, improving parison melt strength and reducing cooling load — a rare case where the same specification helps material cost, cycle time and quality simultaneously.
Barrier or mixing screw designs with Maddock or spiral mixing sections deserve consideration where regrind ratios exceed 25 percent or where color masterbatch dispersion is critical, since blended feedstocks with mixed bulk density and particle geometry are harder to melt homogeneously than uniform virgin pellets. The trade-off is slightly higher specific energy for meaningfully better melt quality — usually the right trade in a cost reduction program, because melt quality converts into weight reduction.
Sizing against realistic utilization
A common selection error is sizing the machine against peak forecast rather than realistic sustained utilization. A machine specified for a demand peak that occurs two months a year will sit at partial load for ten months, carrying full depreciation with diluted output. The more economical structure is usually to size for sustained demand and cover peaks with overtime shifts, which converts a fixed cost into a variable one. Where the program genuinely justifies additional capacity, adding a second smaller machine rather than one larger machine also improves resilience: an unplanned stop takes out half the capacity instead of all of it, and mold changeovers can be staggered.
Where other Wanplas factories fit the same cost problem
Extrusion blow molding is the right process for most handled, non-round, integral-handle and large-volume containers. It is not always the right process. For high-clarity, high-volume round bottles in PET, injection stretch blow molding on equipment from Wanplas’s YuDa factory delivers lower gram weight and higher clarity than EBM can. For small, precision, neck-critical pharmaceutical containers below roughly 250 ml, injection blow molding from Wanplas’s Aibim factory eliminates flash entirely and holds tighter neck tolerance. For converters who granulate and reprocess significant external scrap, pelletizing lines built around twin-screw extruders from Wanplas’s Kerke factory, feeding washing systems from Wanplas’s Polyretec factory, close the material loop at plant level rather than machine level. Choosing the correct process for each container in the portfolio is itself a cost reduction measure, and it is the reason the Wanplas brand maintains specialized factories rather than a single generalist plant.
Building an Indexed Cost Baseline That Survives Audit
Every cost reduction claim eventually meets a skeptical finance function. The projects that survive are the ones measured against a defensible baseline established before the change, using indicators that cannot be gamed by shifting product mix. Three indicators do this job in extrusion blow molding, and they should be indexed to 100 points at the start of the program.
Indicator one: grams of saleable container per kilogram of resin purchased
This single number captures part weight, flash ratio, regrind recovery efficiency, scrap rate and start-up losses simultaneously. It cannot be improved by hiding waste, because purchased resin is an invoice figure and saleable containers are a shipped figure. Track it weekly by product family. A plant running 35 percent flash with 90 percent regrind recovery and 95 percent yield converts substantially less of its purchased resin into shipped product than the same plant at 20 percent flash and 98 percent yield, and this indicator shows the difference immediately.
Indicator two: kilowatt-hours per kilogram extruded
Measure at the machine’s incoming supply, not at the plant meter, and include the machine’s proportional share of chiller and compressed air load if those can be sub-metered. Record it at steady state over a minimum of four hours on a defined product. This is the number that separates drive architectures and validates heating, insulation and air recovery projects. Comparing across products is meaningless; comparing the same product before and after a change is definitive.
Indicator three: good parts per machine hour
Not parts per hour — good parts per hour, calculated over scheduled production time including changeovers and unplanned stops. This is the indicator that captures cycle time, yield and availability in one figure, and it is the one that most directly drives the dilution of fixed costs. A machine producing 1,000 parts per hour at 94 percent yield with 85 percent availability delivers 799 good parts per scheduled hour; improving yield to 98 percent and availability to 92 percent delivers 902, a 12.9 percent improvement with no change to cycle time at all.
- Select two or three representative containers covering the extremes of the product mix.
- Record all three indicators over two full production weeks under normal conditions. Index each at 100 points.
- Change one variable at a time. Parallel changes make attribution impossible and destroy the evidence base for the next project.
- Re-measure over two full production weeks after the change, on the same containers, with the same resin lot family where possible.
- Report the index movement, not the absolute figure, so the result remains valid when resin or power conditions shift.
- Re-baseline annually, or after any machine, tooling or grade change large enough to invalidate comparison.
Common measurement errors
Four errors recur. Measuring energy over too short a window catches a warm-up or a changeover and produces a figure that cannot be reproduced. Comparing yield across different product families conflates geometry difficulty with process improvement. Crediting a weight reduction before the environmental stress crack resistance results return risks booking a saving that becomes a claim. And attributing a whole-plant improvement to a single machine project ignores the fact that plant-level indicators move for many reasons, including product mix, which is why machine-level and product-level measurement is the only reliable approach.
Frequently Asked Questions
Which cost line should an EBM plant attack first?
Resin, without exception on nearly every container program, because it represents 45 to 65 percent of converted cost and because reducing part weight reduces flash and scrap simultaneously. Begin with a parison programming re-optimization on existing hardware, which requires no capital and typically returns 2 to 5 percent within a month, then move to pinch-off and flash geometry work on the tooling. Only after material work is exhausted does energy or labor optimization make sense as a priority.
How much energy does a servo hydraulic EBM machine save against a conventional hydraulic machine?
Measured at the machine supply over a full shift, conventional fixed-displacement hydraulic machines typically consume 0.75 to 1.05 kWh per kilogram of polymer extruded, while servo hydraulic machines consume 0.45 to 0.65 kWh per kilogram. That is a 30 to 45 percent reduction, and it comes from the pump delivering flow only on demand instead of continuously bypassing oil over a relief valve. The secondary benefit is a 50 to 70 percent lower oil cooling load, which reduces chiller energy as well.
Is a fully electric EBM machine always the lowest total cost choice?
No. Fully electric machines reach 0.35 to 0.50 kWh per kilogram, eliminate hydraulic maintenance entirely, and offer the best motion repeatability, but the capital tier is Premium. The advantage compounds only under high utilization, and below roughly 4,000 operating hours per year a servo hydraulic machine usually returns faster. Fully electric becomes the correct choice regardless of utilization where hydraulic oil is unacceptable — pharmaceutical, medical device and certain food contact environments.
How many parison programming points are genuinely useful?
It depends entirely on how much the container profile varies along its height. Straight-wall cylindrical bottles rarely justify more than 32 points, and going beyond that produces diminishing returns. Handled jerrycans, shouldered detergent bottles, offset-neck containers and anything with a complex base typically gain 8 to 15 percent weight reduction moving from 32 points to 100 points or more, particularly when radial wall thickness control is added to handle circumferential blow ratio variation.
What flash ratio should a well-run EBM line achieve?
Handleware on legacy tooling with unoptimized parison control commonly runs 30 to 35 percent flash. With reworked pinch-off land width and angle, tightened mold shut height, correctly matched die and mandrel, and disciplined parison length control, 18 to 22 percent is a realistic sustained target on the same container. Moving from 35 to 20 percent reduces required extruder throughput per saleable kilogram by about 19 percent, freeing capacity without additional machinery.
How much regrind can be blended back without damaging container performance?
For monolayer HDPE packaging, 20 to 35 percent clean in-house regrind is standard practice, subject to melt flow rate drift staying within plus or minus 15 percent of the virgin reference and material seeing no more than two thermal passes. Keep it below 15 percent where environmental stress crack resistance is a critical requirement. Multi-layer structures containing EVOH need a dedicated regrind layer rather than uniform blending, because tie layer and barrier fragments disrupt a homogeneous wall.
What cooling water temperature and flow condition give the shortest cycle?
Mold water between 8 and 12 degrees Celsius with turbulent flow, meaning a Reynolds number above 4,000 in every individual circuit, is the practical optimum for HDPE containers. Turbulence matters more than temperature: many plants run cold water through laminar circuits and receive a fraction of the available heat transfer. Splitting long series circuits into shorter balanced parallel circuits with individual flow meters commonly removes 8 to 15 percent from cooling time at negligible cost.
Does multi-layer co-extrusion always increase cost?
No. Barrier structures with EVOH do increase material cost per kilogram, but structures that confine pigment to thin skin layers or that carry regrind in a protected core layer reduce it. A three-layer color-skin structure can cut masterbatch consumption by 40 to 60 percent with no visible difference in the finished container, and a three-layer regrind-core structure lets a converter run 30 to 50 percent regrind in the core while keeping virgin material on both product-contact and external surfaces.
How should a cost reduction project be validated?
Index three indicators at 100 points before the change: grams of saleable container per kilogram of resin purchased, kilowatt-hours per kilogram extruded, and good parts per machine hour. Change one variable at a time, re-measure over two full production weeks on the same containers, and report index movement rather than absolute figures so the result stays valid when input conditions shift. Never credit a weight reduction before environmental stress crack resistance testing has returned.
Conclusion and Practical Next Steps
Reducing production cost with high efficiency EBM machines comes down to four levers applied in the right order. Material first, because resin is 45 to 65 percent of converted cost and because high-resolution parison programming, disciplined flash reduction and controlled regrind reuse together reach into double-digit percentage savings. Cycle time second, because turbulent cooling circuits, internal air exchange and the right station architecture dilute every fixed cost across more units. Yield third, because a rejected container has already consumed everything a good one consumed. Energy fourth — real, measurable, strategically important, and the easiest to verify, but generally a smaller absolute share than the other three.
The machine sets the ceiling on all four. A 100-point programmer with radial control, a servo hydraulic or fully electric drive delivering 0.35 to 0.65 kWh per kilogram, ceramic or infrared heating with insulation, a properly engineered cooling circuit, and cavitation matched to actual program volume is not a specification list — it is a cost structure. Converters running that specification operate on a different economic curve from those running legacy hydraulic equipment with coarse programming, and no amount of operator skill closes that gap.
Begin with the wave-one items from the optimization matrix: insulation jackets, cooling circuit re-balancing, gravimetric regrind blending, checkweighing with cavity feedback, and a parison programming re-optimization on existing hardware. These require no capital approval and typically aggregate to 6 to 12 percent of converted cost within a single quarter. Establish the three indexed indicators before you start, change one variable at a time, and let the measured results build the case for the capital projects that follow.
Apollo, a Wanplas factory in Zhangjiagang, builds ten series and more than eighty models of extrusion blow molding machines covering containers from 200 ml through the large-volume ABLD range, processing PE, PP, PVC, PA, PC, ABS, PS, EVA, TPU and PETG for food and beverage, daily chemical, chemical industry, building material, medical and pharmaceutical, automotive and transportation applications. Machines are built and tested under an ISO 9001 quality management system, with an annual free spare-parts allowance, transportation guarantee, production capacity guarantee and quality guarantee applied as Wanplas brand-level commitments across all factories. If you are evaluating a specific container against a specific cost target, send the container drawing, the resin grade, the annual volume and your current cycle time and part weight, and Apollo’s technical team will return a machine configuration, a projected specific energy figure and a realistic weight reduction estimate for that geometry — the three numbers that determine whether the project is worth doing.